In the cryptocurrency market, significant developments continue with steps towards Ethereum ETF funds following positive data from the Fed. Along with this process, Ethereum has managed to join the rise initiated by Bitcoin. What can be expected for Bitcoin and Ethereum in the coming period? We analyze with detailed chart analysis and important levels.
Bitcoin Chart Analysis
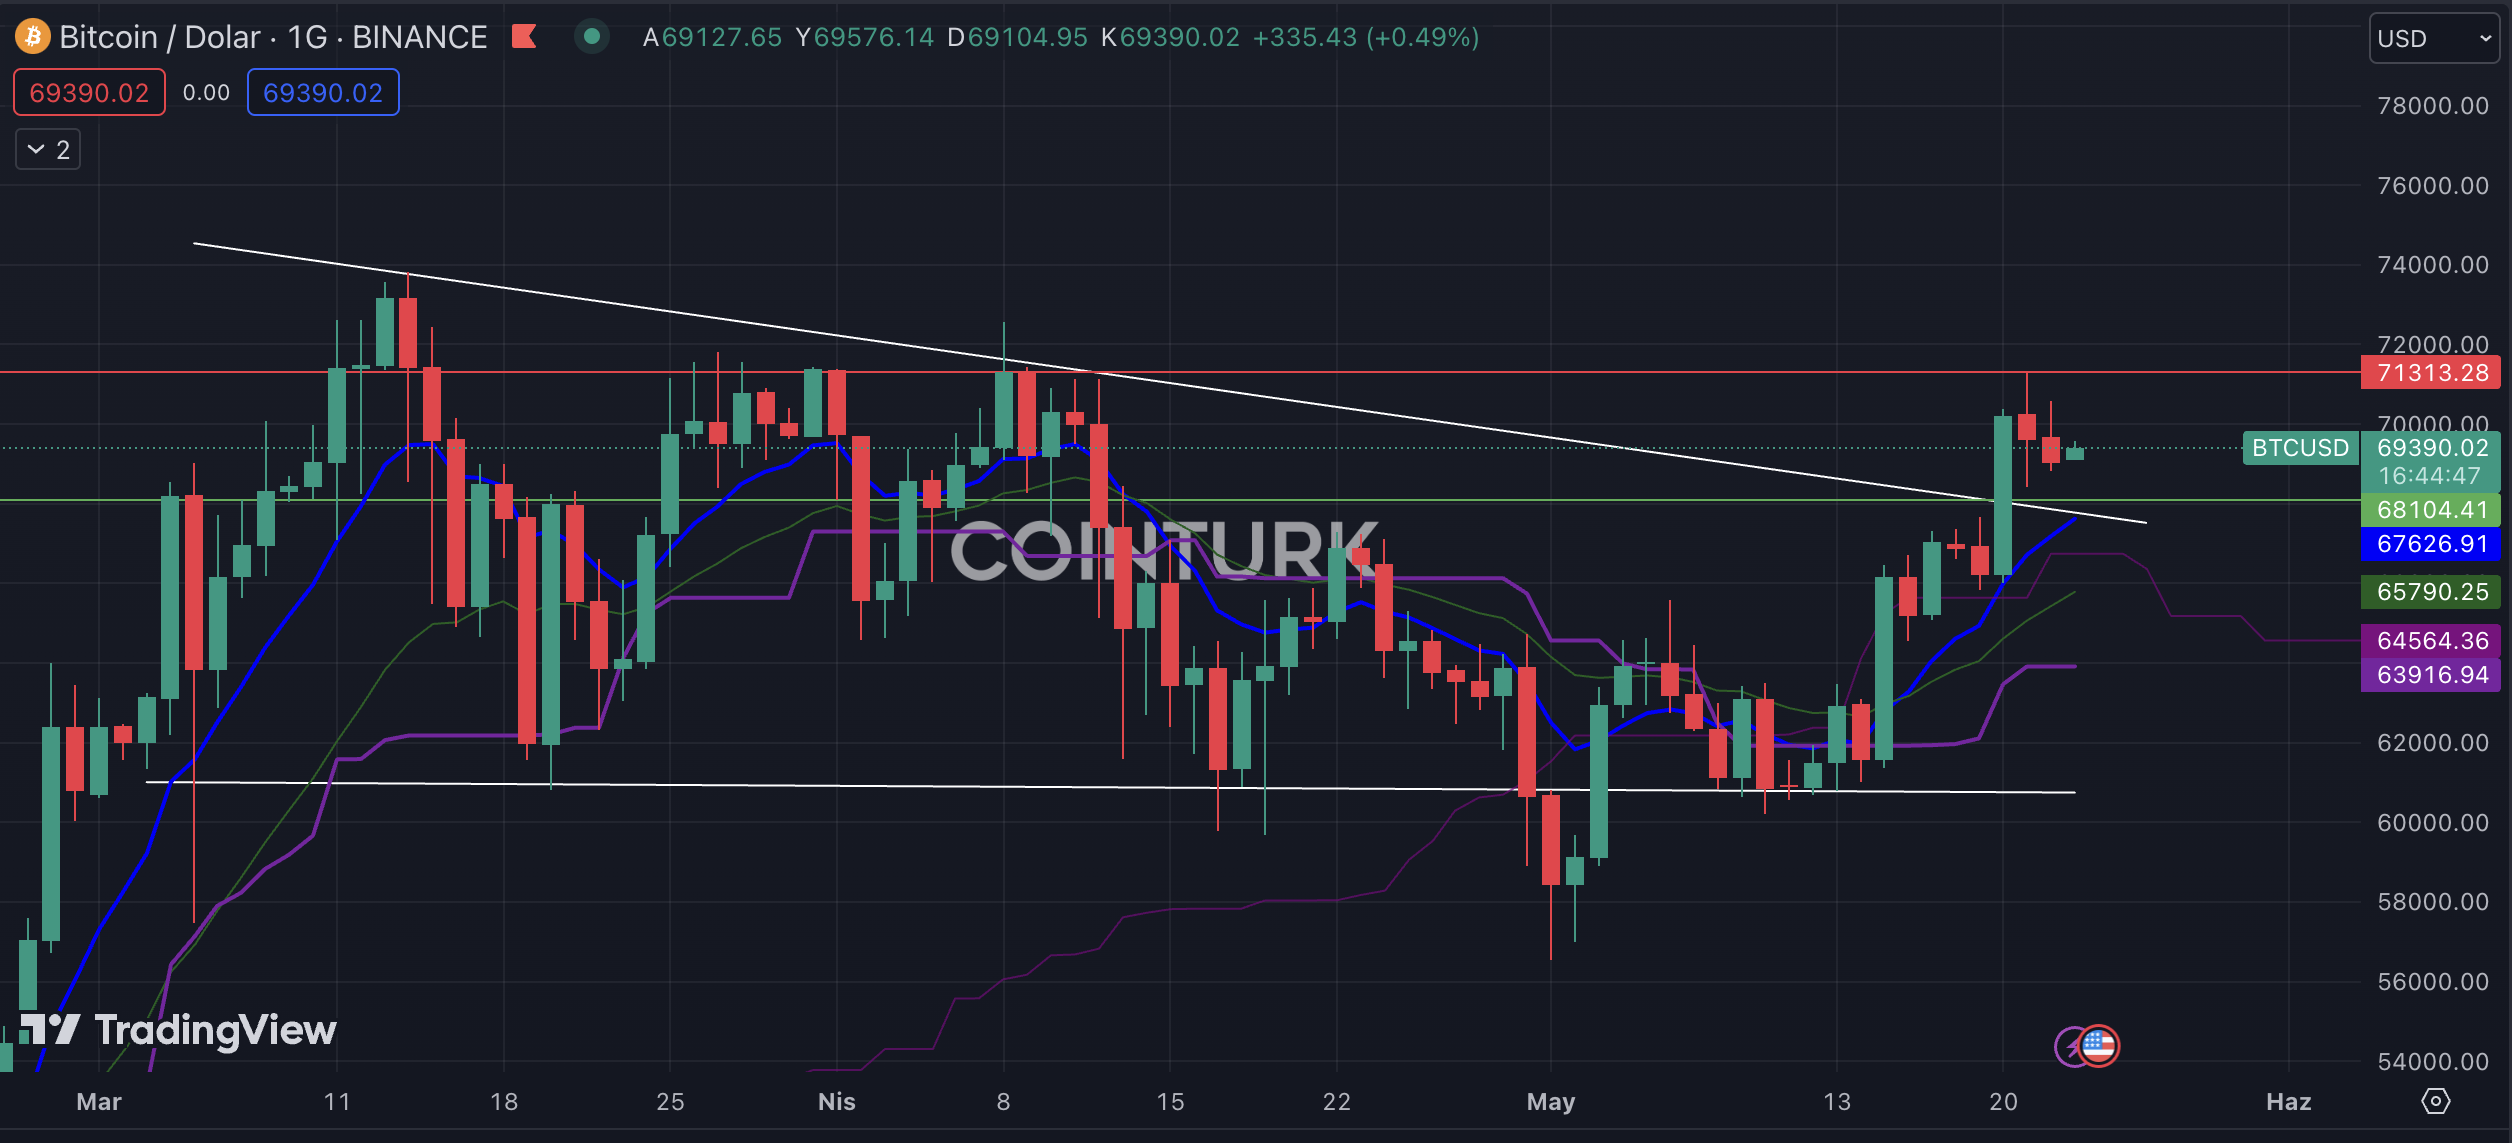
In the daily Bitcoin chart, the narrowing wedge formation has provided significant clues to investors over the past month. With the recent rise, Bitcoin managed to break the formation resistance line. However, an important resistance level confronted us here, and no notable rise has been observed for Bitcoin in the past three days.
The most important support level to watch in the daily Bitcoin chart is $68,104. This level is significant as it intersects with both the formation resistance line and the EMA 9 average (blue line). A daily bar close below this level could cause a drop in Bitcoin’s price.
The most important resistance level to watch in the Bitcoin chart is $71,313. This level also came into play in the first week of April and posed a significant obstacle. A daily bar close above this level could give momentum to Bitcoin’s price.

Ethereum Chart Analysis
In the daily Ethereum chart, the resistance breakout in the triangle formation was successfully achieved after a long period. The rise triggered by news initiated a significant liquidation process in the futures market. For Ethereum, which has been trading in a narrow range in recent days, a support or resistance breakout will determine the direction.

The most important support level in the Ethereum chart is $3,661. A daily bar close below this level could create selling pressure for Ethereum. The most important resistance level to watch for Ethereum is $3,828. A daily bar close above this level could support the rise. Also, you can watch our latest analysis video on the CoinTurk YouTube channel:


