The optimistic phase in the crypto market for Ethereum ETF funds has given way to a pessimistic period following decisions by the SEC. This shift has resulted in a loss of the upward momentum in Ethereum’s price. The resistance level formed around $4,000 seems to continue to be a significant barrier for Ethereum’s price.
Ethereum Chart Analysis
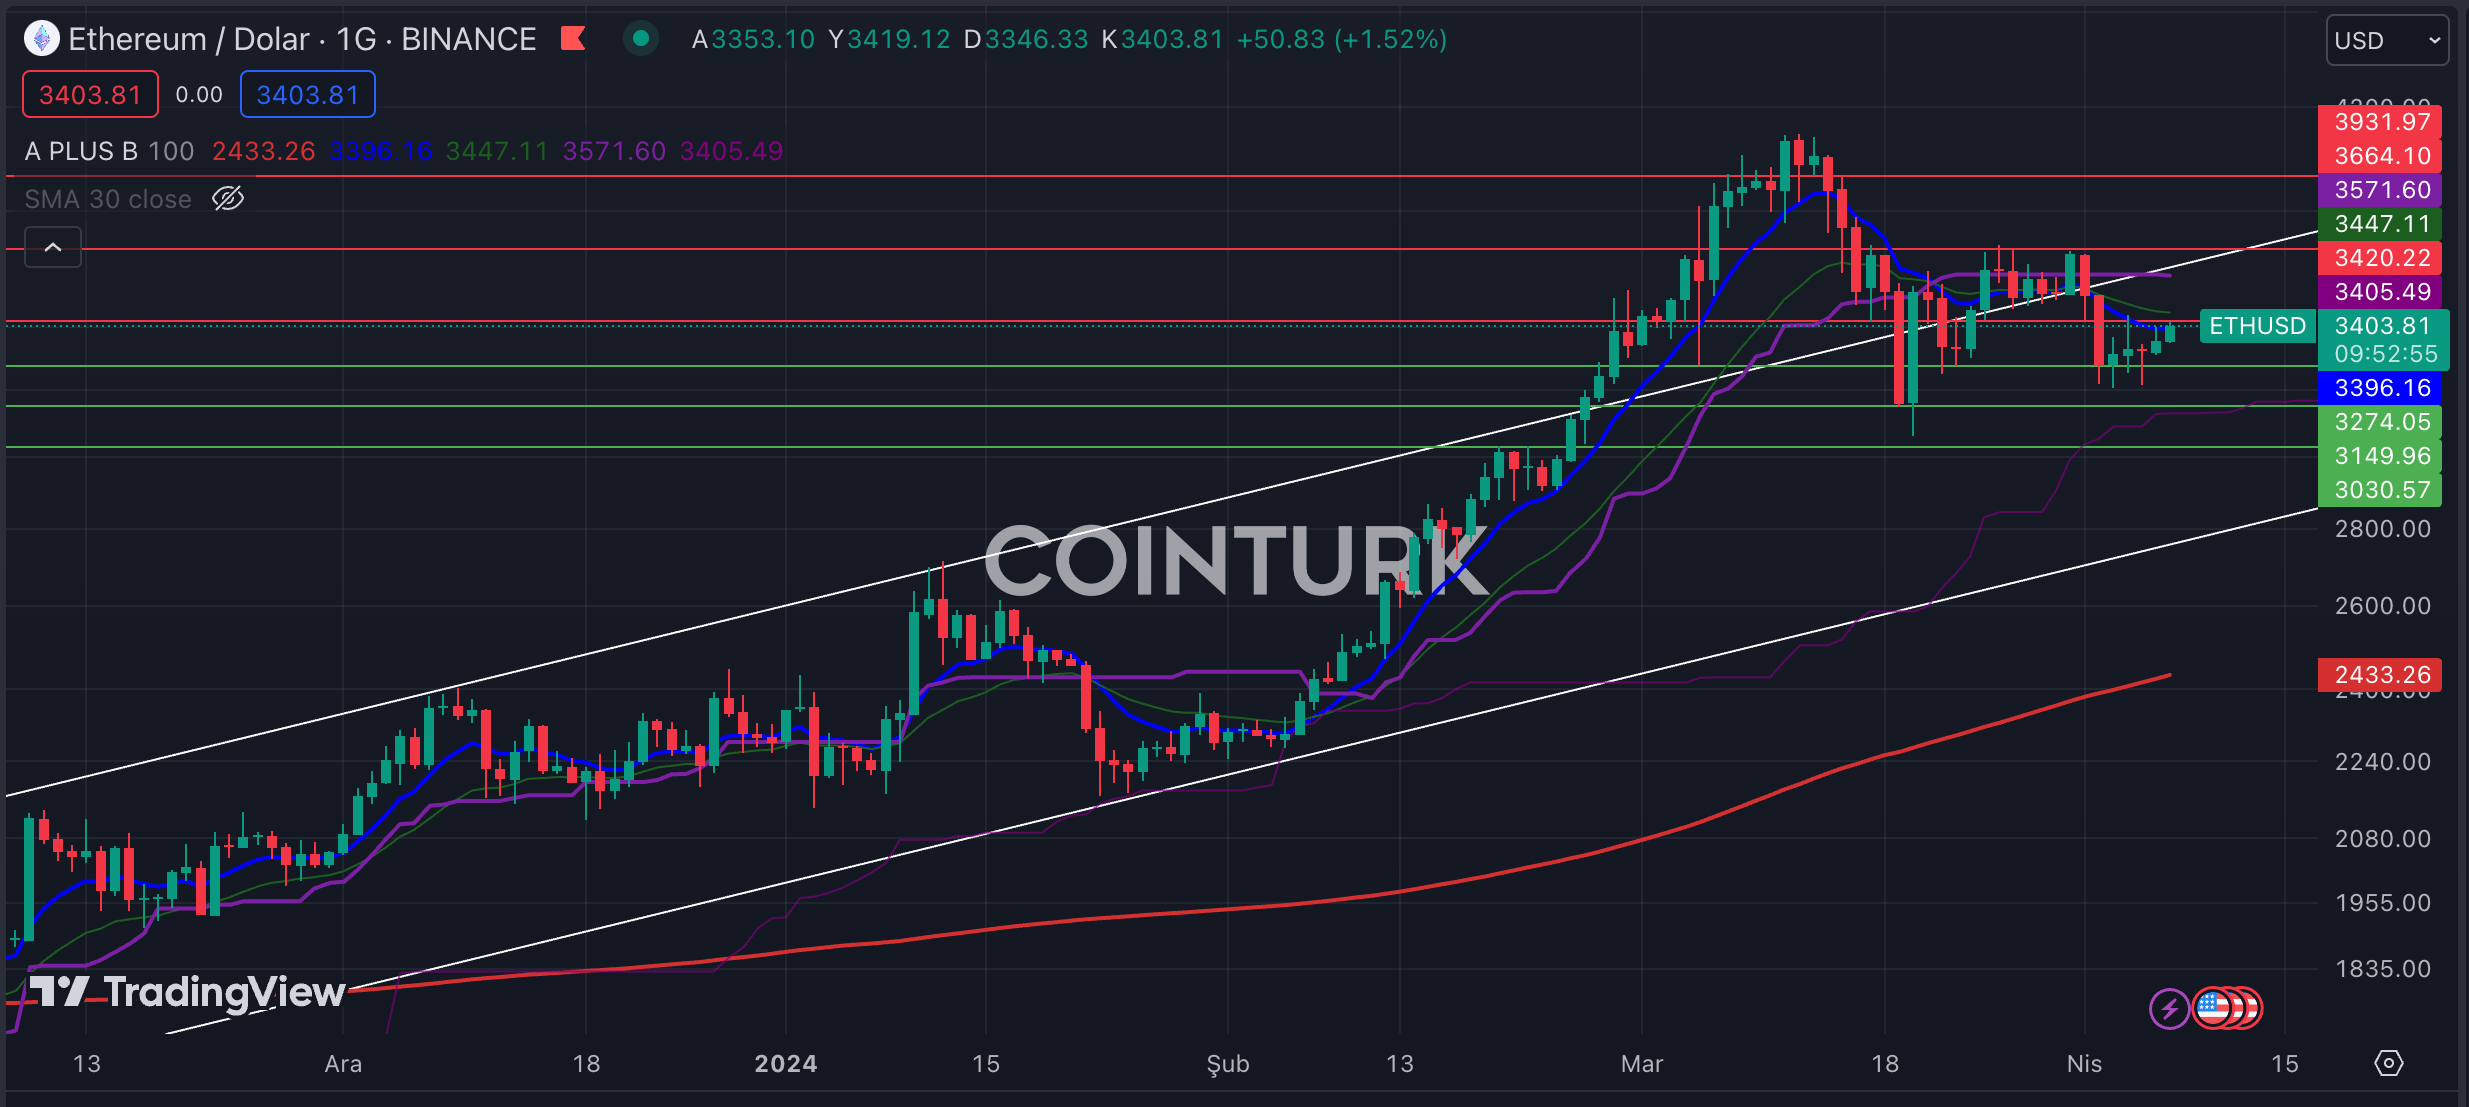
The rising channel formation on the daily Ethereum chart, which began at the end of February with ETF activity, managed to break the resistance line. However, recent events have caused Ethereum’s price to lose momentum, pulling the price back into the formation zone. The EMA 9 (blue line) acting as resistance at the time of writing suggests a negative short-term scenario for Ethereum’s price.
The most important support levels to watch on the daily Ethereum chart are; $3,274 / $3,149 and $3,030 respectively. A daily bar close below the crucial support level of $3,274 will likely lead to a loss of momentum for Ethereum’s price.
The most important resistance levels on the daily Ethereum chart are; $3,420 / $3,664 and $3,931 respectively. A daily bar close above the $3,420 level, which intersects with the EMA 9, would help Ethereum’s price gain momentum.

ETH/BTC Chart Analysis
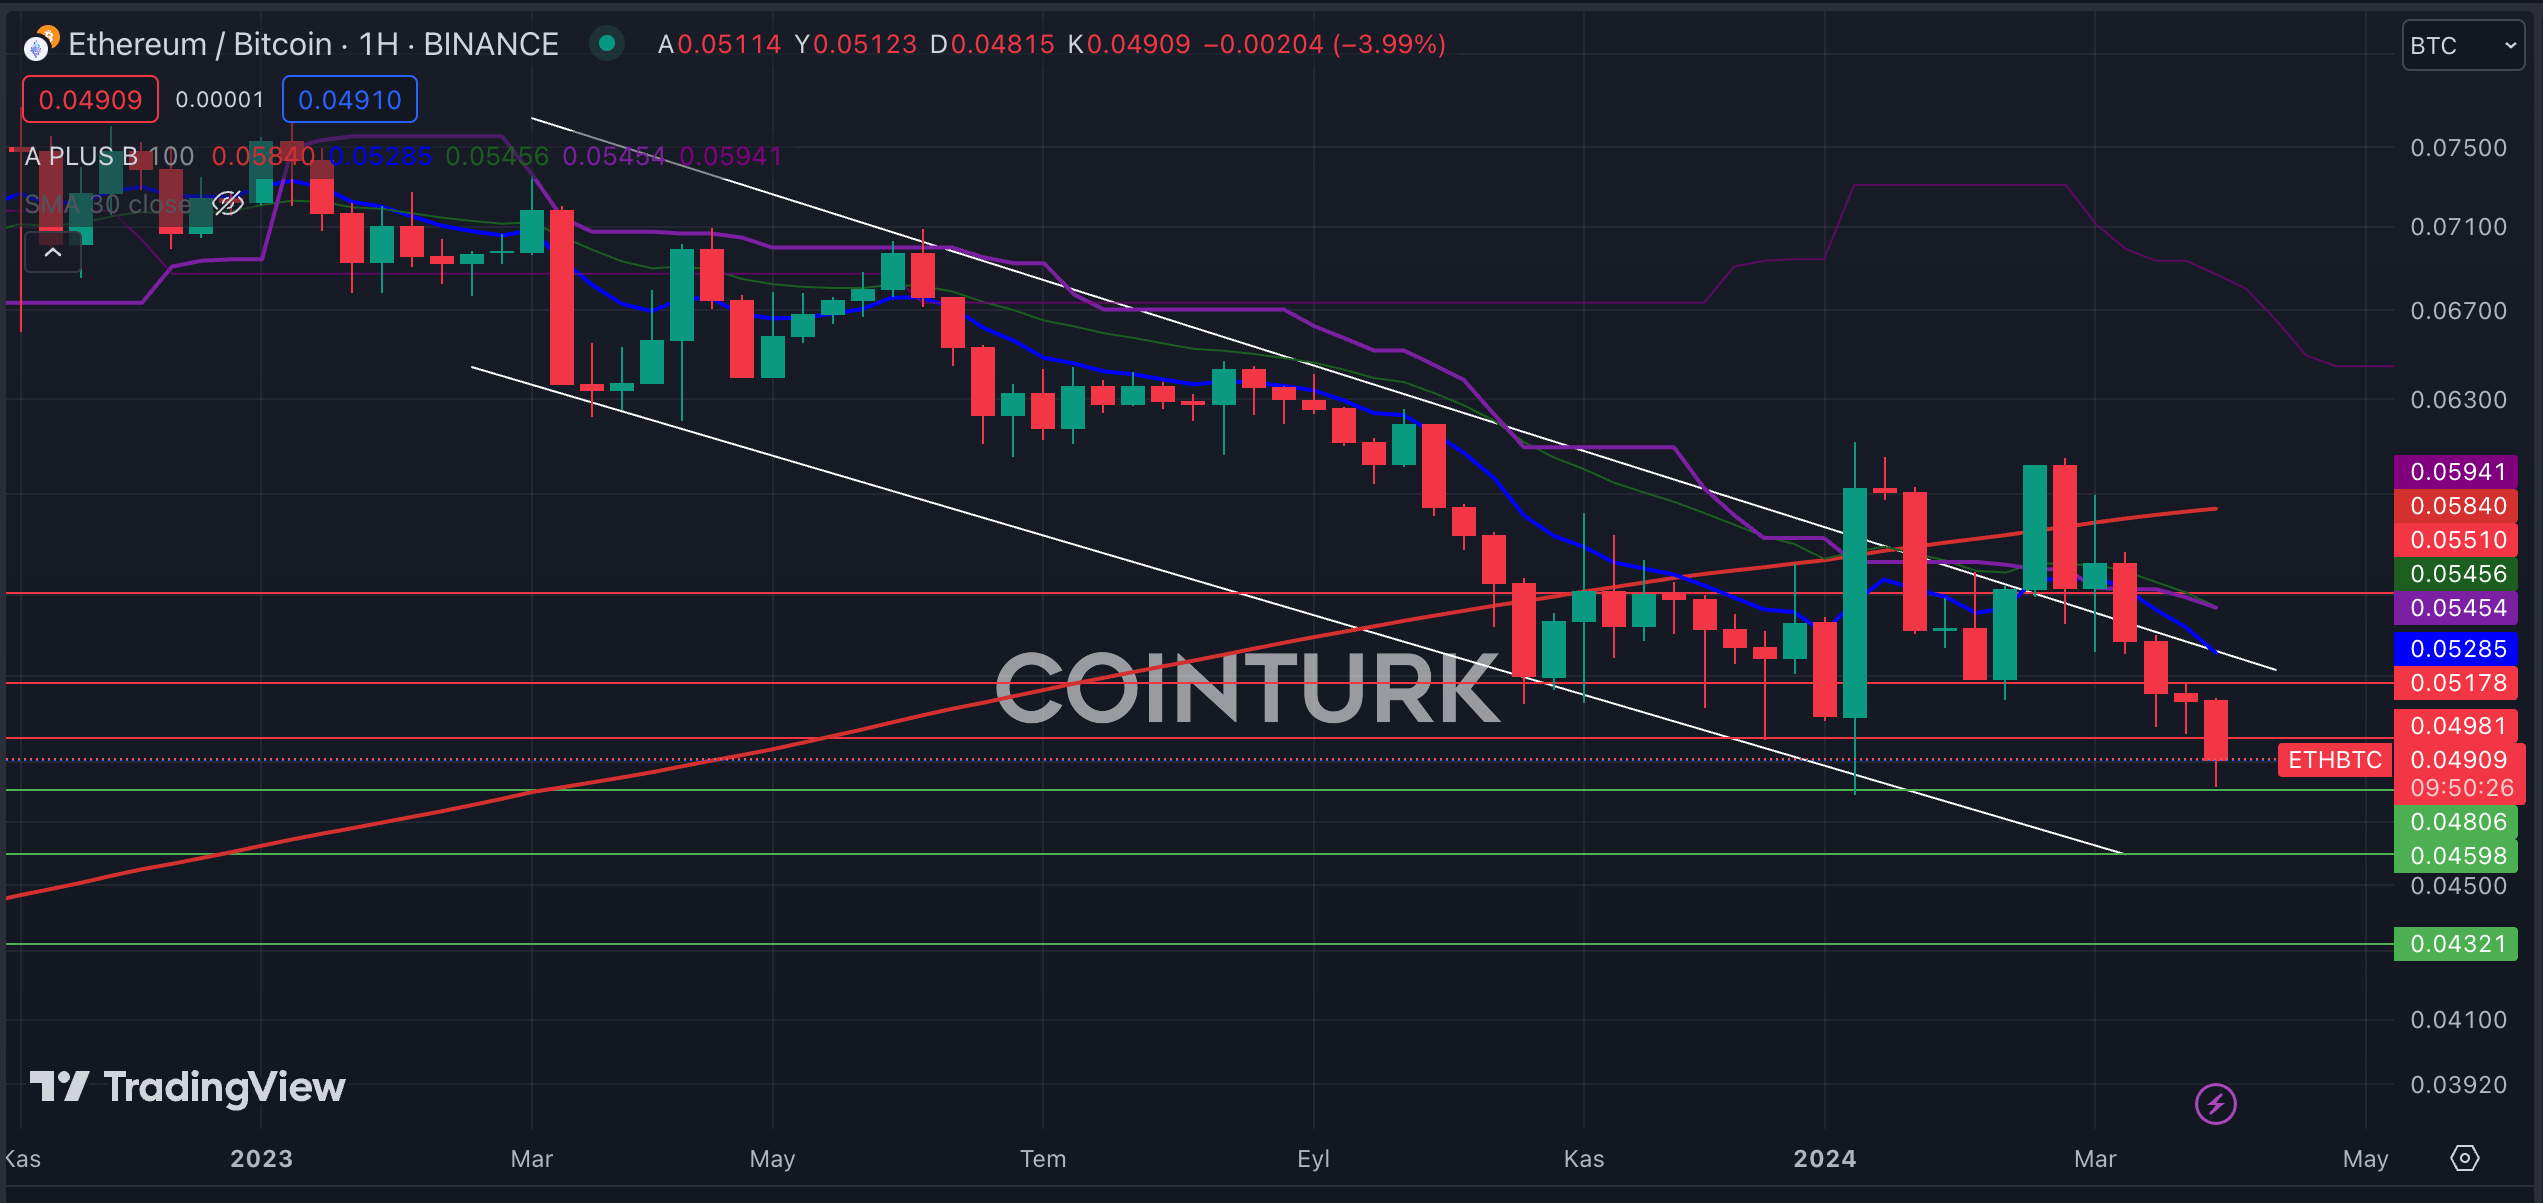
The falling channel formation on the weekly ETH/BTC chart is a structure that investors should monitor closely. Despite breaking the resistance line with ETF news, the ETH/BTC pair continues to trade within the formation zone, indicating Ethereum’s loss of value against Bitcoin.
The support levels to pay attention to on the weekly ETH/BTC chart are; 0.04806 / 0.04598 and 0.04321 BTC respectively. A weekly bar close below the significant support level of 0.04806 BTC could lead to Ethereum losing value against Bitcoin.
The most important resistance levels on the weekly ETH/BTC chart are; 0.04981 / 0.05178 and 0.05510 BTC respectively. A weekly bar close above the 0.05510 BTC level, which intersects with the EMA 21 (green line), would indicate Ethereum gaining value.


 Türkçe
 Español


