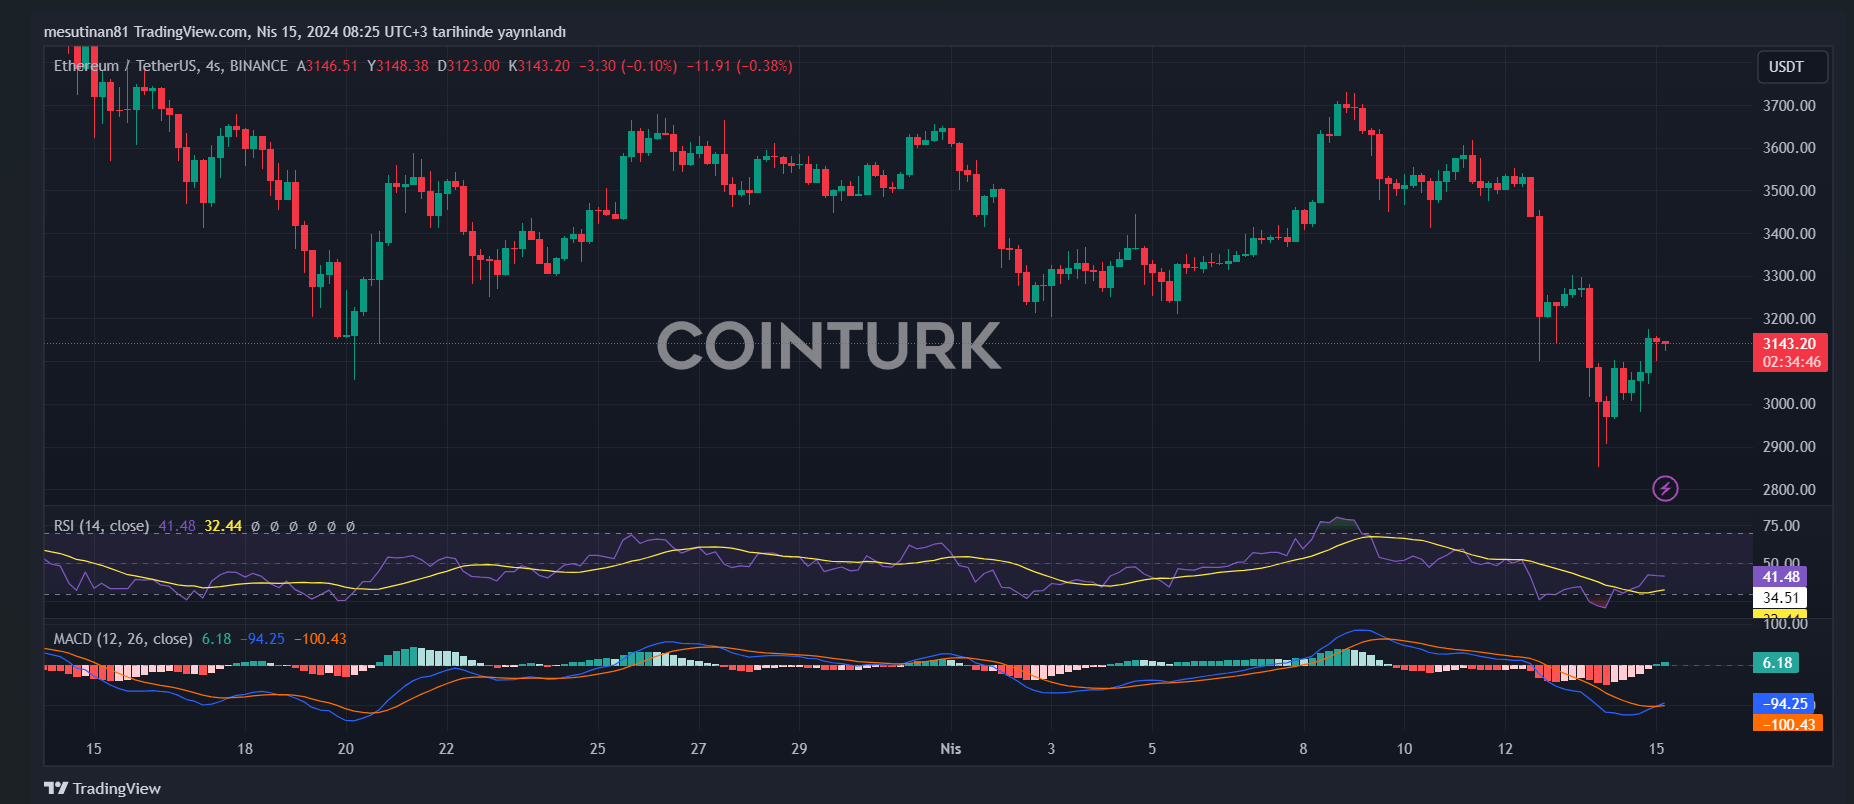
Ethereum recently experienced a significant price drop, but bulls quickly appeared around the $2,852 mark. This decline resulted in a drop of over 10%. However, ETH rapidly recovered above $3,000 and is now facing several hurdles around $3,200. So, what levels should be monitored for Ethereum‘s price from this point?
Ethereum Price in Recovery Phase
Ethereum is facing a recovery wave from the support zone of $2,550. However, the price is trading below $3,250 and the 100-hour Simple Moving Average. On the ETH/USD 4-hour chart, a rising channel is forming with resistance near $3,200. Yet, if the pair stays above the support zone of $3,000, it could gain upward momentum.

The recent decline began with a major drop from the resistance level of $3,550. ETH fell below $3,000 after a retreat of over 10%. The lowest level was around $2,852, and the price is currently attempting a recovery wave similar to Bitcoin. The price has risen above the resistance levels of $2,800 and $3,000.
Rising Channel Forming in ETH
Ethereum is currently trading below $3,250 and the 100-hour Simple Moving Average. A rising channel with resistance near $3,200 is forming in ETH/USD. The first major resistance is near the $3,250 level. The next key resistance is at $3,300, above which the price could test the $3,360 level.
The critical barrier could be at the $3,500 level, where ETH might gain bullish momentum. In such a case, the price could rise towards the $3,620 region. If there is a move above the $3,620 resistance, Ethereum could even rise towards the $3,750 resistance level.
Critical Levels for Ethereum
If Ethereum’s price fails to surpass the resistance level of $3,250, it could start a new downward trend. For now, the first support level on the downside is around $3,080. However, if a more serious decline occurs, significant support exists below the $3,000 region.
Breaking this level could trigger a drop towards $2,880. Furthermore, a move below the critical support level of $2,880 could pull Ethereum down to the $2,750 level. At this point, a drop to the $2,550 level could become even more likely.
What Do Technical Indicators Suggest?
Looking at technical indicators, the hourly MACD for ETH/USD is losing momentum in the bearish zone. However, the hourly RSI is currently above the 50 level, indicating some buying interest.
The main support level to watch for investors is $3,000. If the price falls below this level, a larger downward trend could begin. On the other hand, if the price surpasses the resistance level of $3,250, bulls could strengthen their control, and we might witness an upward price movement.

 Türkçe
 Español


