Cryptocurrency market, especially Ethereum investors, have recently been on quite an emotional journey. The recent sudden changes in Ethereum‘s price have excited both bulls and bears, increasing uncertainties about the future. So, what does this volatility in Ethereum’s price mean? Can the bulls regain strength?
Sudden Changes in Ethereum’s Price
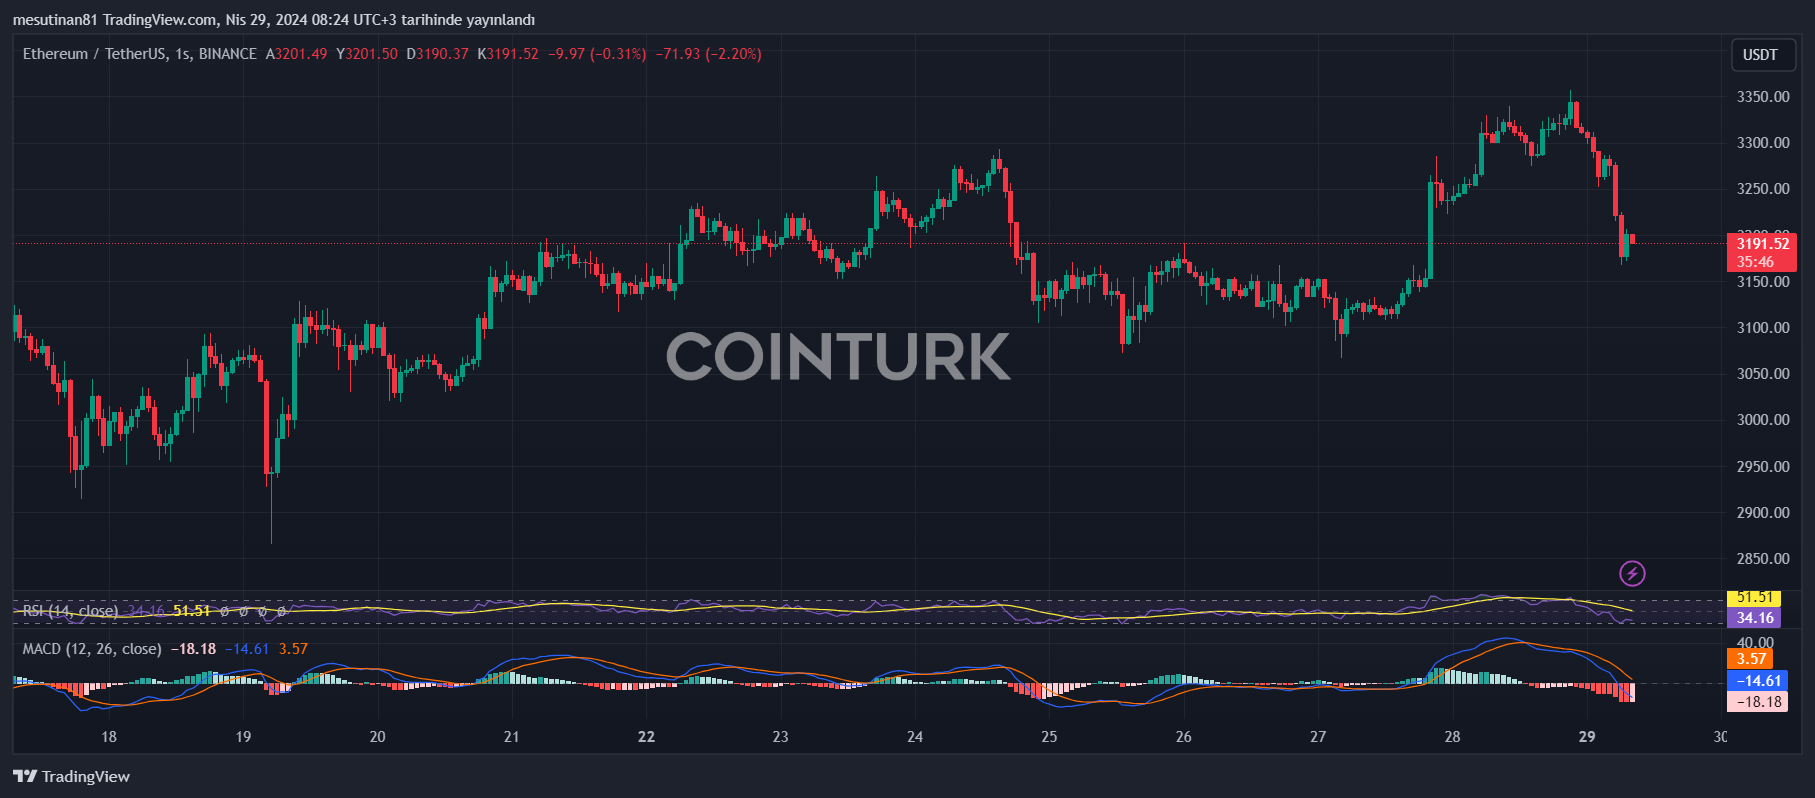
According to recent data, the price of Ethereum managed to rise above the $3,300 level. However, after this rise, it tested the $3,350 resistance level and unexpectedly fell below $3,300. This sudden drop in Ethereum has alarmed investors and increased uncertainties in the market.

Especially when we look at Ethereum’s hourly chart, we see a break below the important support level of $3,250. This situation indicates that Ethereum could fall further in the short term. However, it seems there is still hope for the bulls. Currently, a move towards the $3,165 support level could indicate that Ethereum might regain upward momentum.
Especially now, we see Ethereum facing a move towards the $3,250 resistance level. If this resistance is overcome, it might be possible to test the next key resistance level of $3,350. However, a sustained move above this level could indicate that Ethereum might re-enter an upward trend.
Further Declines in ETH Could Bring These Levels into Focus!
Price movements in the ETH/USD pair show that overcoming a certain resistance level is challenging. If Ethereum cannot surpass the $3,210 resistance level, the likelihood of a downward movement continuing strengthens.
Looking at the current situation, the first support level for Ethereum is around $3,180. However, a larger support appears near the $3,165 region. A break below these levels could pull the price further down.
Especially, a drop towards the main support level of $3,070 could cause significant losses in the market. In this case, Ethereum’s price could fall to as low as $3,030. Further losses could soon bring the $2,880 level into play.
Technical Data Indicates a Downturn for ETH
According to technical indicators, the hourly MACD for the ETH/USD pair is gaining momentum in the bearish zone. Similarly, the hourly RSI (Relative Strength Index) is currently below the 50 level. These indicators show that the market’s current state is moving more towards a bear trend than a bull trend.
The main support level identified at $3,165 and the main resistance level at $3,210 are critical for Ethereum’s short-term performance.


