The price of Ethereum is trading at $1895, with a 0.64% increase in the last 24 hours. The cryptocurrency market is showing impressive recovery since last week, led by Bitcoin and the anticipation that the U.S. Securities and Exchange Commission (SEC) will greenlight a spot Bitcoin ETF. Many leading altcoins are following the recovery trend of the biggest cryptocurrency. The largest altcoin, ETH, increased its value by over 18% with its jump from $1627 in the midst of this rally. So, is the ETH price ready to continue this rally or will it face a correction in the short term and lose value? Let’s take a closer look at the Ethereum price analysis.
Ethereum Price Analysis
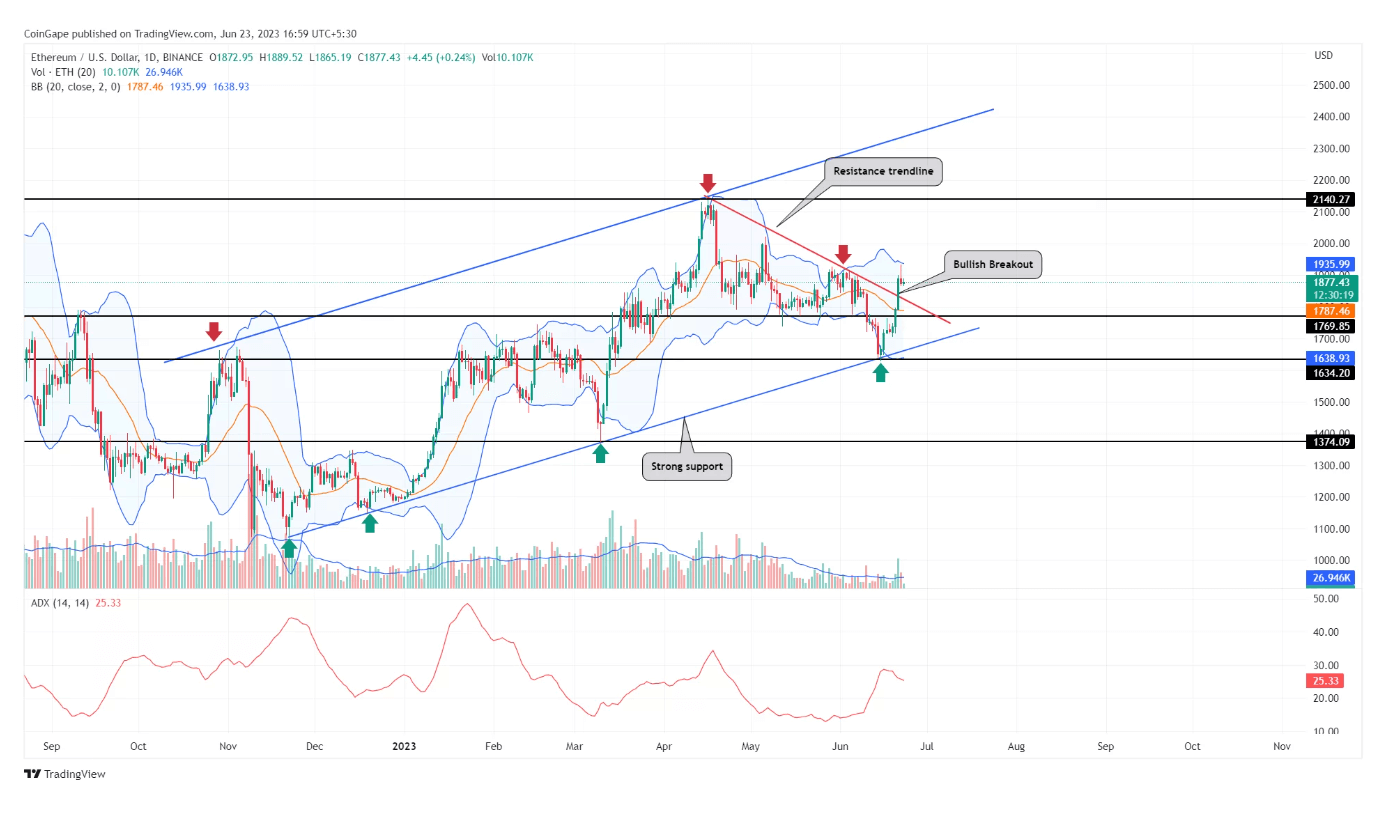
The daily timeframe chart shows the downward sloping resistance trend line (red) that triggered the recent correction in the Ethereum price. With the recent recovery in the price, buyers made a strong breakout from this dynamic resistance trend line on June 21. The breakout occurred with a large increase in volume, reflecting buyers’ belief that the price will rise further. However, despite the rise on June 22, the price of the biggest altcoin couldn’t pass the $1926 resistance.

The long rejection candle lit at the $1926 resistance reflects the overall supply pressure that could drop the price. A potential return could be expected to retest the recently broken downward sloping resistance (now support) trend line and work as support to trigger the next jump.
Will ETH Price Cross $2000?
A pullback to the downward sloping resistance trend line that ETH recently broke could give buyers a chance to catch their breath before continuing the current recovery cycle. If Ethereum price can show sustainability above the resistance-to-support trend line, it can be seen that the price of the largest altcoin goes to $2138, the highest level of the year, with a further 13.8% increase.
The Average Directional Index (ADX) on the daily chart also indicates that buyers are extremely strong for a robust recovery during the current rally. On the other hand, the upper band of the Bollinger Band indicator moving horizontally at the $1926 level is increasing the resistance strength of the level for the rise to turn into a decline.


