The term metaverse, one of the biggest stars of the last bull season, and the cryptocurrencies under it experienced significant declines afterward. Especially during this period, Sandbox and MANA attracted great attention not only as cryptocurrencies but also as projects. Today, as games are taken to completely different levels, there seem to be strong expectations that the term metaverse could be revived. In this direction, it has also been observed that projects have started to establish significant partnerships.
Floki and OG Partnership Announced
FLOKI, which has taken significant steps in the metaverse field, considered an important part of the future of the cryptocurrency world, has signed a major partnership. It was announced that the other party of this partnership is the world-famous E-sports team OG.
The mentioned partnership will cover the metaverse game called Valhalla. The OG Esport team was founded in 2015 and achieved great success. The team, founded by DOTA’s two significant players FLY and Notail, known for their multi-million dollar prize pools, later became world champions twice and won many tournaments. Crypto Traders Are Rushing to This App – Here’s Why You Should Too
At the same time, it is thought that the brand’s partnership with Red Bull, one of the world’s largest organizations, could have a significant impact on Floki’s recognition.
What is Floki’s Price?
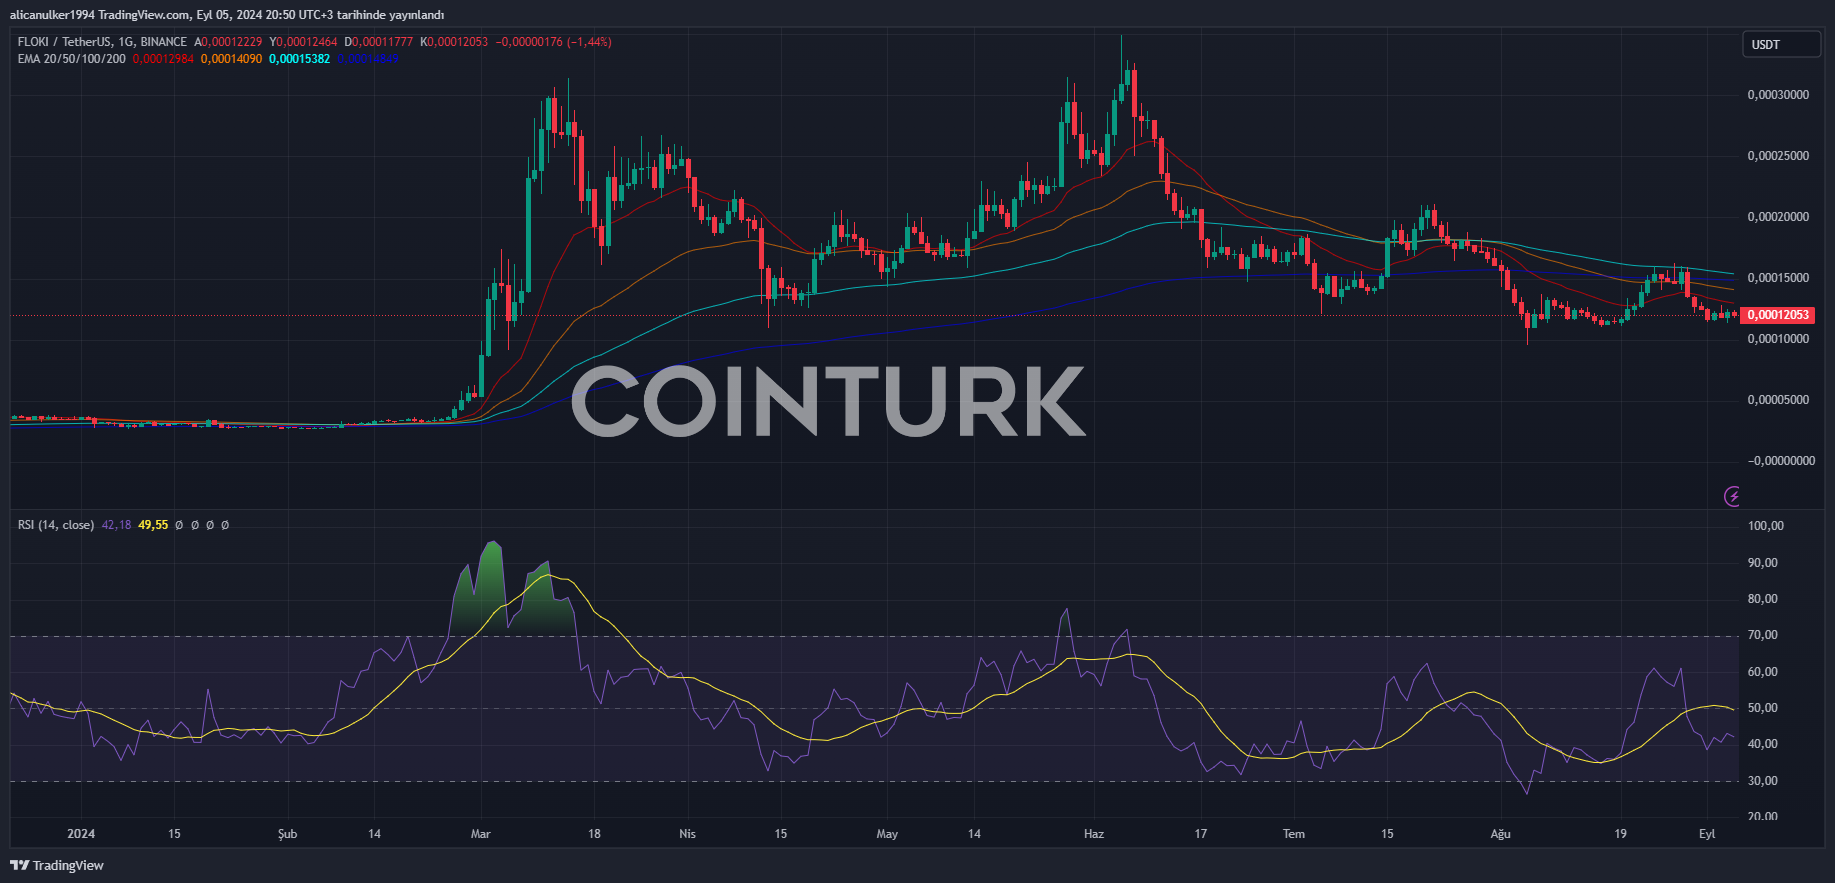
After the news, attention turned to the FLOKI price. During the period when Bitcoin fell below $56,000 and rose again to $56,500, FLOKI also experienced a decline. FLOKI fell to $0.00012053 after a 1.31% drop in the last 24 hours.

This decline in FLOKI caused the market cap to drop to $1,156, while the trading volume also pulled back by 18% despite the news, reaching $144.4 million.
FLOKI’s RSI value continues to show fluctuating movement. Lastly, seen above the 50 neutral level 7 days ago, the RSI continued its decline and was recently reflected in the charts as 42.18. Although this does not indicate overselling, it can be interpreted as the selling pressure continuing.
When looking at FLOKI’s EMA values, it is seen that all of them are below, and more importantly, it is understood from the chart that it approaches but never surpasses the 20-day EMA. This level is seen as a resistance and a region that needs to be overcome for a rise.


 Türkçe
 Español


