There are only a few popular altcoins that have been favored by former cryptocurrency investors and have a 6-7 year history. These are cryptocurrencies that have successfully resisted and survived the test of time. While most altcoins cannot even withstand a single bear market, these coins have managed to come out alive from many chaotic situations.
Is XLM Coin a Good Investment?
Stellar (XLM), which entered our lives in 2015 (the project started in 2014), has successfully stood the test of time. As one of the largest cryptocurrencies for years, this popular altcoin continues to survive even in the current bear market. Long-term analysis suggests that the price of Stellar may be on the verge of a new bull market. If the scenarios of the previous two cycles repeat themselves, XLM could rise up to 350% in the next few months.
 Crypto Traders Are Rushing to This App – Here’s Why You Should Too
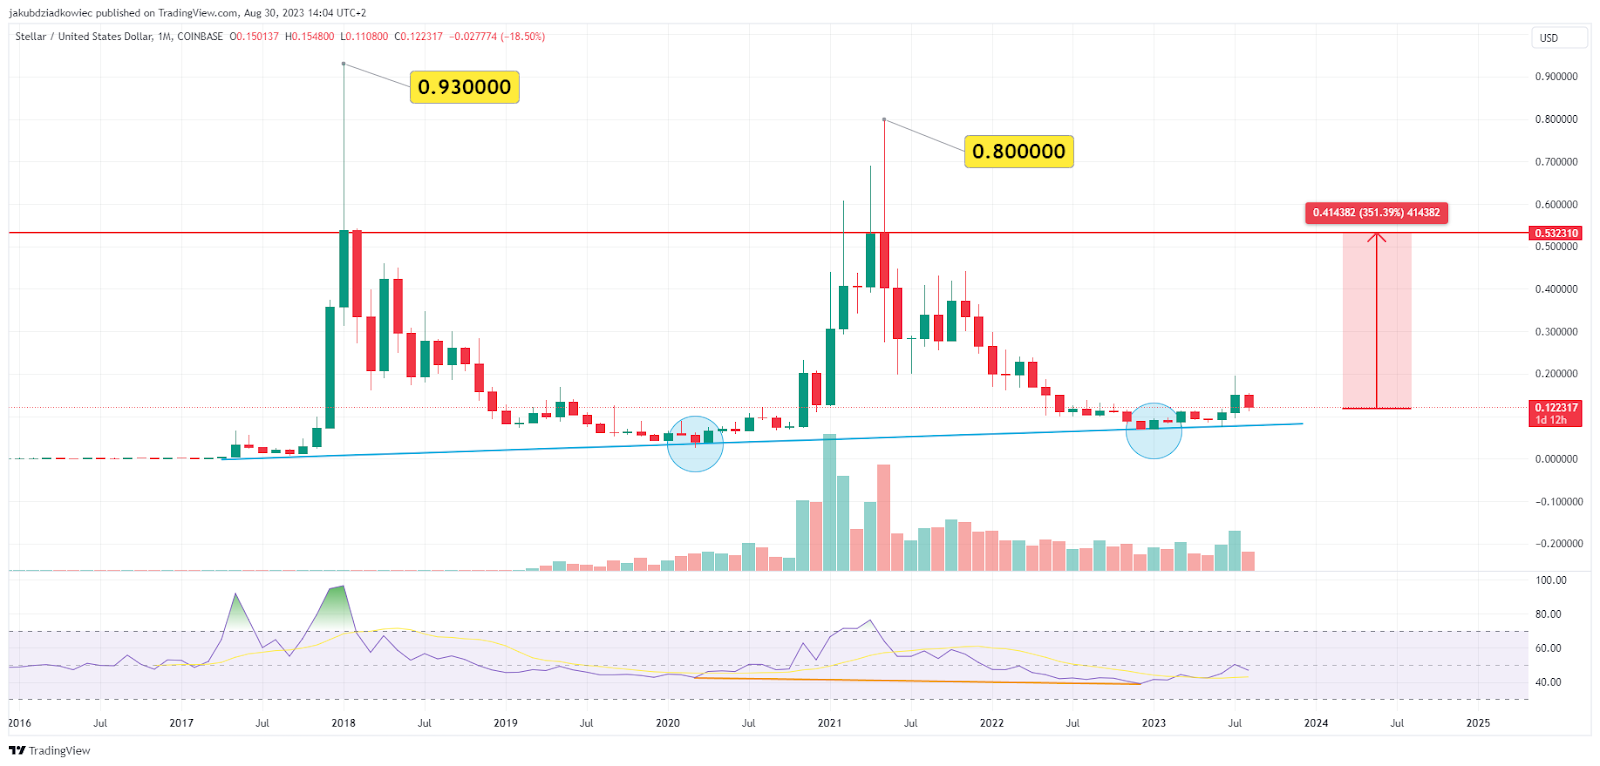
The long-term monthly chart of XLM price provides an insight into the history of this altcoin since its launch in 2015. Unlike many cryptocurrencies released during that period, the XLM Coin price chart shows an upward trend.
Most importantly, the Stellar price has experienced two bull markets that reached similarly high valuations. In early 2018, the XLM price reached an all-time high (ATH) of $0.93. During the 2021 bull season, it reached its peak at $0.8.
XLM Coin Price Chart
The supporting factor for the long-term bullish outlook is the repeated monthly closing at $0.53 in the previous cycle. If we are going to witness the third repetition of this rally, the price will need to experience a 350% increase from its current level of $0.12. This means investors could make a 3.5X profit in the next few months.
There is another thing supporting the parabolic rise. The long-term rising support line that has been in existence since April 2017 is an important point that should not be overlooked. So far, this support has been confirmed in the macro bottoms of the previous two bear markets. Additionally, the monthly chart of Stellar price has formed a rarely observed long-term hidden bullish divergence. The RSI indicator recorded a lower level in 2022 than the lowest level in 2020. In contrast, the XLM price formed a higher low during the same period.
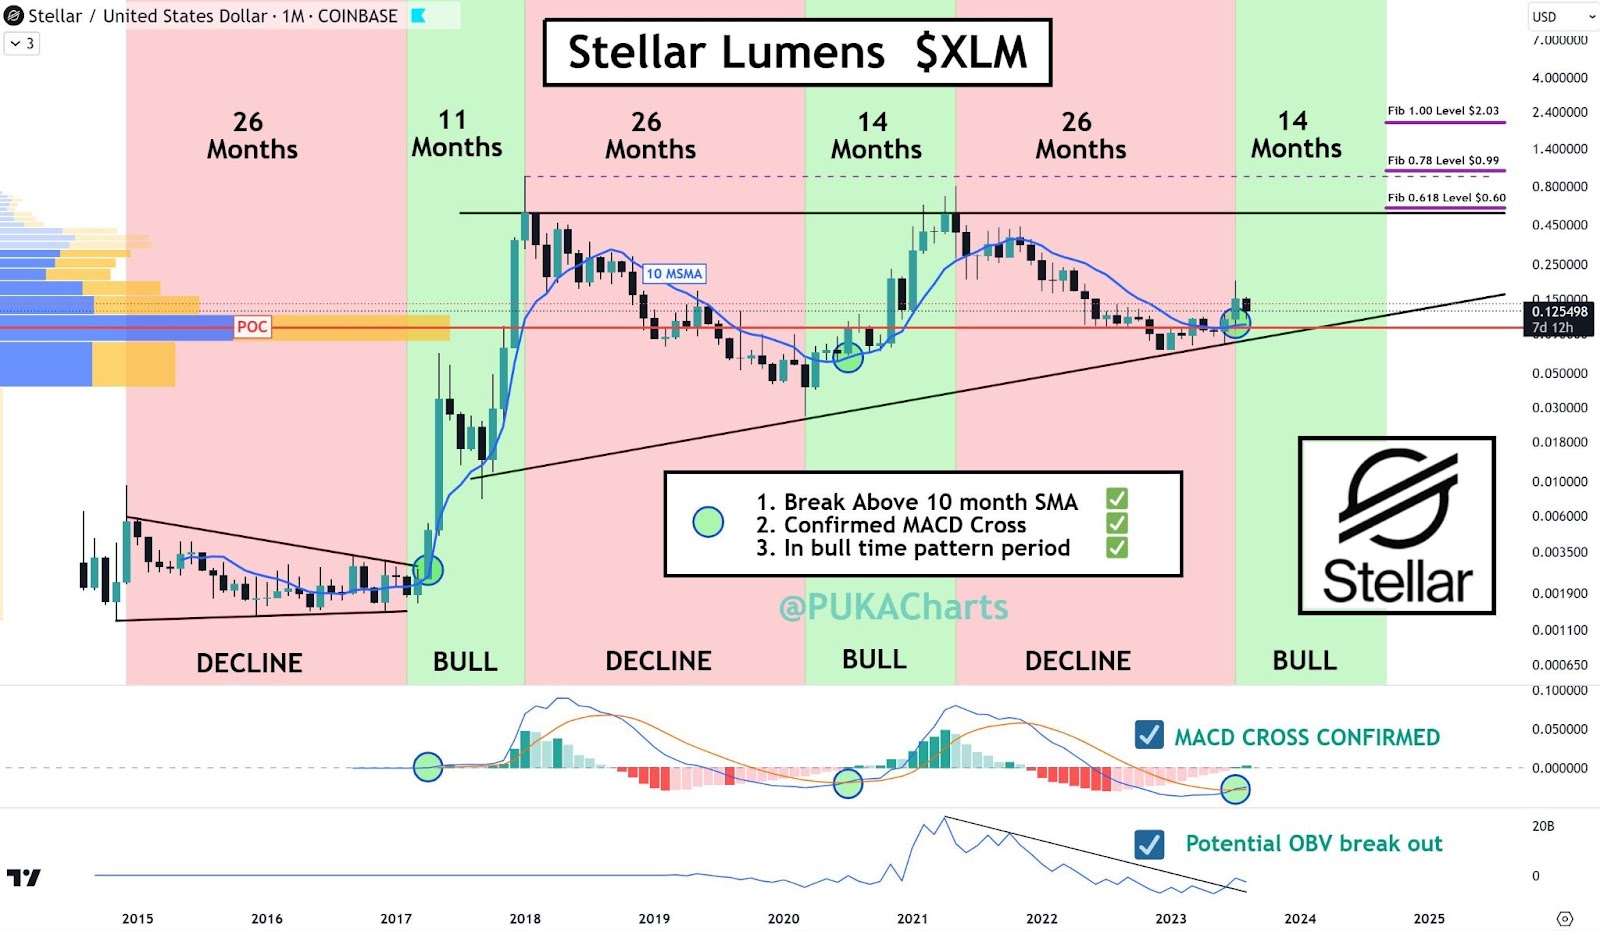
Crypto analyst known as PUKACharts warned that the parabolic rise is approaching for XLM Coin price.
“Break above the 10-month SMA
Confirmed bullish crossover on the MACD
Both signals visible in the green window of the bull market
Break above the POC
Break above the resistance line on the OBV indicator”

However, if history does not repeat itself, the popular altcoin may experience significant losses and drop to $0.08.


 Türkçe
 Español


