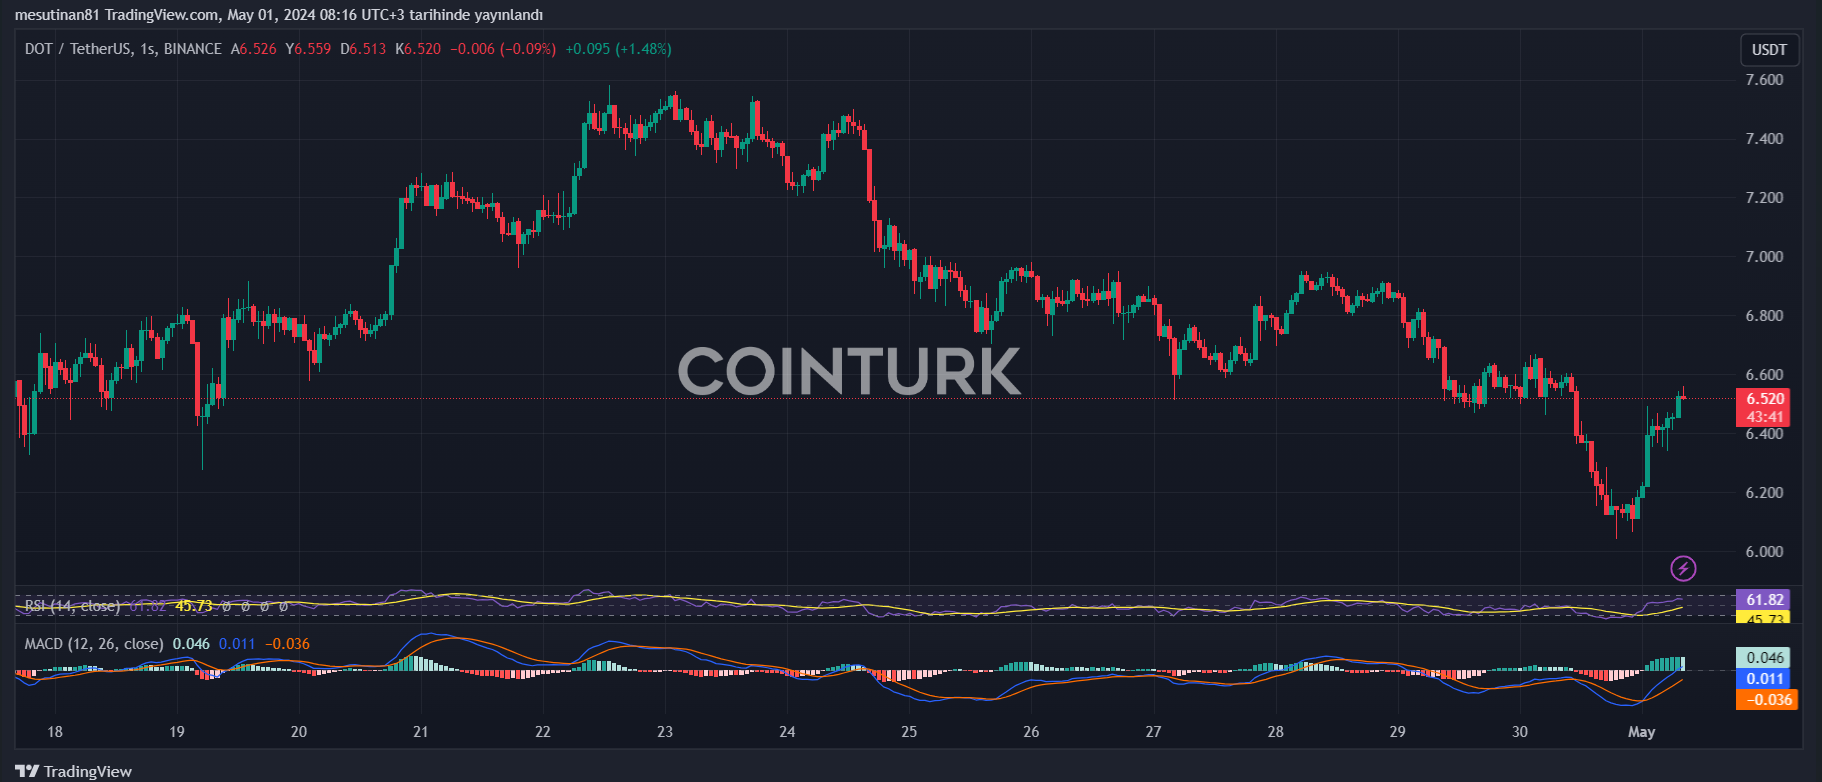
Polkadot (DOT), recently exhibits a noticeable downward trend against the dollar. If DOT’s price cannot sustain above the $6.00 level, the downward trend may continue. The DOT/USD pair has accelerated its decline below the $8.80 and $8.00 levels. A clear downtrend line with resistance at $6.50 is observed on the 4-hour chart, which could signal a drop towards the $5.00 support zone.
Polkadot (DOT) Faces Strong Resistance
Although Polkadot’s price has recently experienced a steady increase, it encountered strong resistance around $7.60. After forming a short-term peak due to this resistance, it initiated a new downward trend below $7.00.

A move below $6.20 deepened the decline, with the price reaching a low around $6.03. Currently, the price is trying to balance these losses and is slowly rising above the $6.35 level.
Which Levels Could a DOT Price Drop Bring Into Focus?
DOT continues to be affected by the recent fluctuations in the cryptocurrency market. Currently unable to initiate a rise above the $7.00 level, DOT shows signs of a further downward movement. What should investors do in this situation?
DOT/USD pair’s technical analysis helps identify key support and resistance levels. Currently, if DOT cannot start an increase above the $7.00 level, the likelihood of a continued downward trend seems quite high.
The first significant support level is around $6.00. However, if it falls below this level, the price could decline to $5.65 and even $5.00. Moreover, further losses could open the doors to a move towards the support zone or trend line at $4.20.
Technical Indicators Suggest a Downward Trend
Looking at the technical indicators, we see that the hourly MACD for DOT/USD has lost momentum in the bearish zone. This situation seems to confirm a possible downward trend in the price. Additionally, the hourly RSI (Relative Strength Index) is below the 50 level, which could indicate that bears are beginning to take control of the market.
It is important for investors to closely monitor these support and resistance levels and update their strategies according to the market’s direction. Support levels like $6.00, $5.65, and $5.00 could serve as important guides for future price movements, while resistance levels like $6.50, $7.00, and $8.50 should be carefully watched for upward movements.


