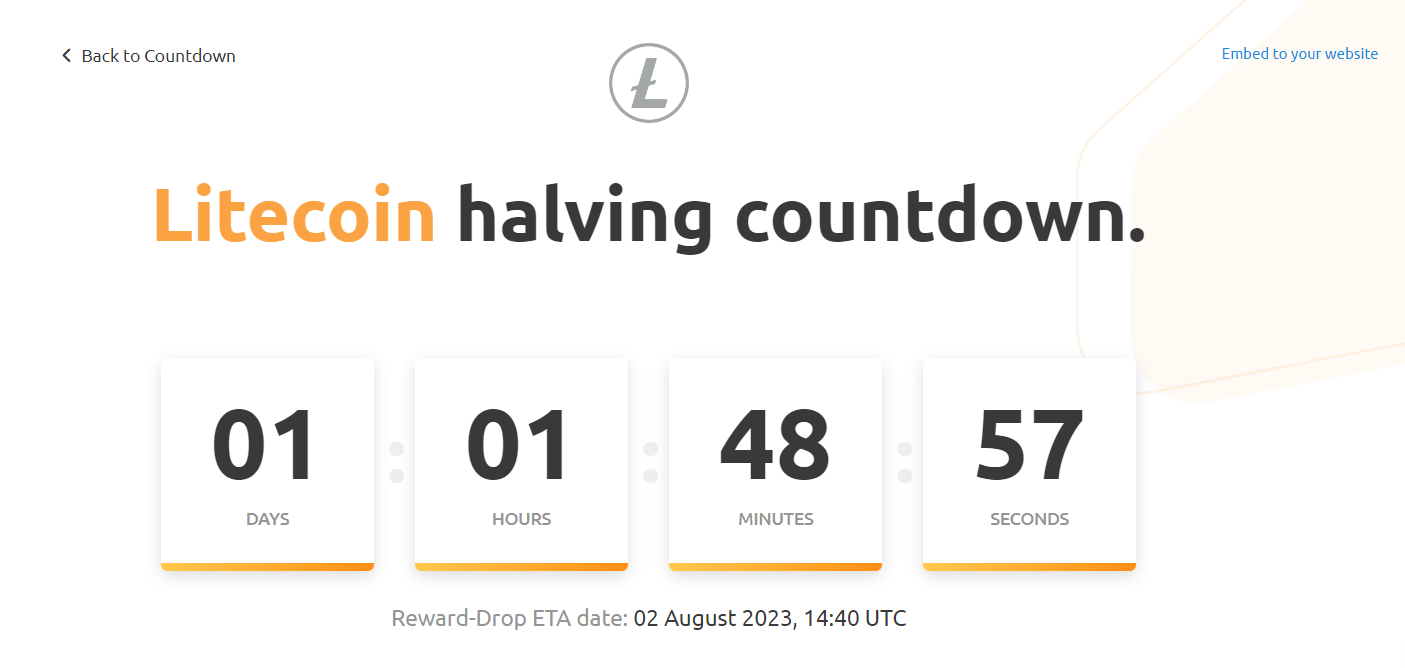
Crypto investors woke up to a difficult day, as the anticipated negative scenario unfolds. BTC is at the support level of $28,800, which has led to a decline in the important support levels of altcoins. LTC is one of them. The popular cryptocurrency is trying to hold at the $90 level, just one day before the halving event.
Litecoin (LTC) Analysis
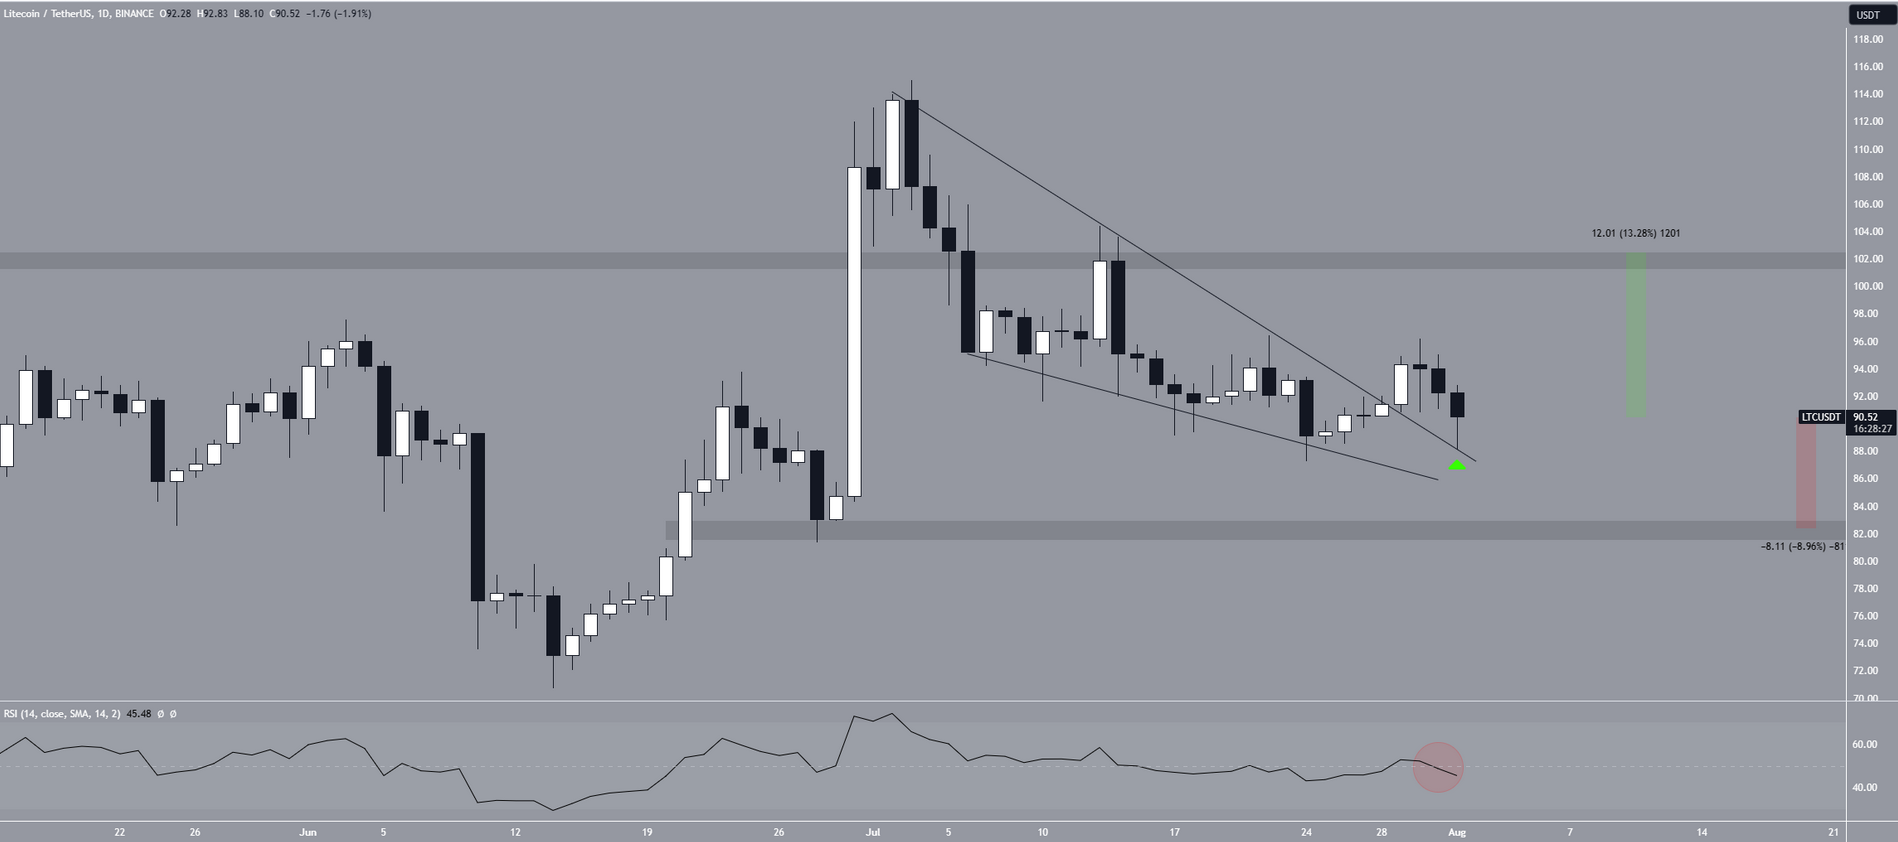
Litecoin (LTC) price broke out of a short-term bullish formation but failed to sustain its upward movement. The price is currently trading near pre-breakout levels. In any case, as long as the price does not close below the pre-breakout levels, the trend can still be considered bullish. However, the negativity in Bitcoin‘s price suggests that the $28,300 support level may soon be tested.

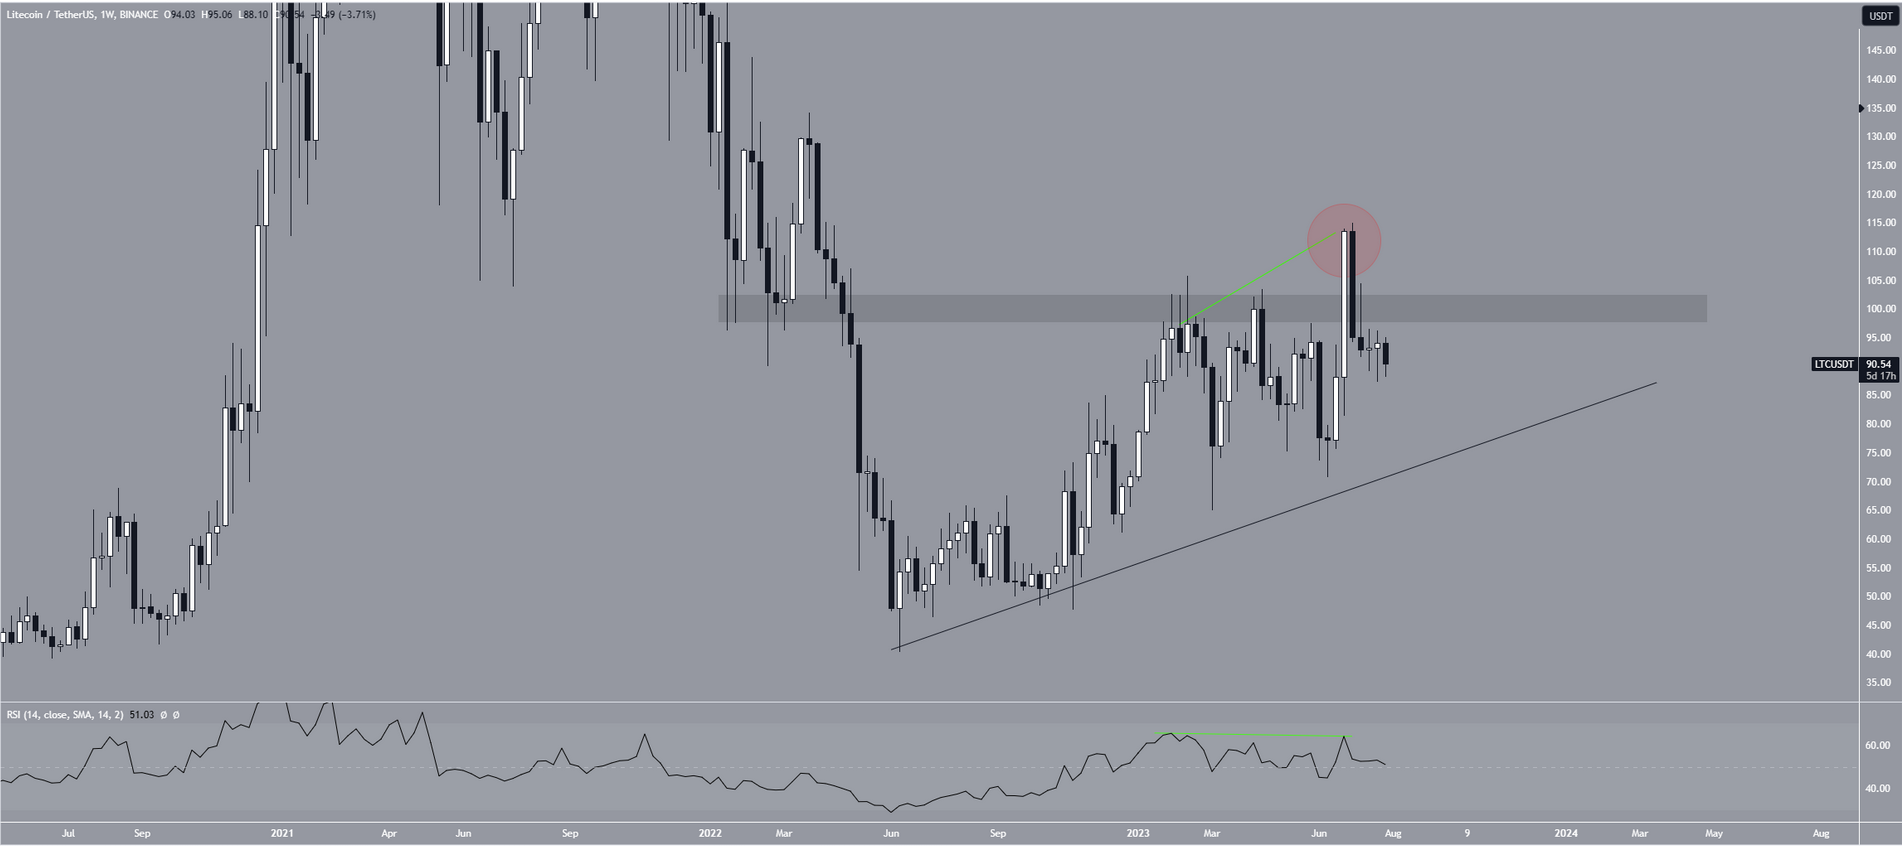
The weekly chart indicates that LTC’s decline could accelerate. This reading is supported by the RSI indicator. The long-awaited Litecoin halving event this week failed to trigger the expected major rally, and the negative sentiment in the overall market is concerning.

LTC Coin Chart Analysis
On the weekly chart, LTC price has once again confirmed the $100 level as resistance. Upon closer examination, it can be seen that Litecoin’s price broke out of a descending wedge on July 28. A wedge is considered a bullish formation, and a breakout from it was expected to lead to a significant upward movement. However, shortly after the breakout, LTC price fell, confirming the wedge resistance line at $88. This created a long lower wick, indicating the possibility of a retest of the previous resistance. However, the RSI does not support this possibility. The indicator dropped below 50 and is moving downwards. This is a sign of a downtrend and is not associated with breakouts from bullish formations.

It is also worth noting that the price rapidly declined during the previous two halving periods. Therefore, if there is no short-term rally in the next four weeks, market experts have been suggesting that the decline will gain momentum. For now, this seems to be the case for LTC.
If the price closes below the $88 resistance area in the coming hours, we may see an acceleration of the decline. This could trigger rapid sell-offs towards $82. However, if it continues to stay above $90, and BTC recovers, the $102 resistance area could be tested. It is important to note that despite the halving event being one day away, whales continue to accumulate.


