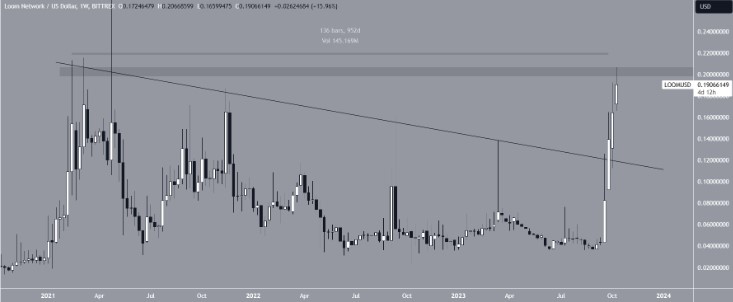
LOOM Network (LOOM) has risen to $0.210 with its recent price movement, attracting attention as the highest level of the year. The $0.200 level, which is considered as the last resistance before the ATH point of $0.770 for LOOM, has also been surpassed. Will it enter the top 100 cryptocurrencies according to market value?
LOOM Reaches the Highest Level of the New Year
In the technical analysis conducted on a weekly basis for LOOM, it is observed that an important price movement has occurred. This significant movement that took place at the beginning of this month was reflected in the charts as the long-term declining resistance trend line was broken. What made this situation special was that the trend line had been in existence for 3 years. With this movement, the rise in LOOM, unlike Bitcoin and other cryptocurrencies, delighted investors and brought new excitement to the crypto world. Before the declining trend line was broken, it was expected to be crossed five times at this point.
LOOM has gained speed since its entry into the market and has now reached $0.210, the highest level of the year. The altcoin then experienced a small pullback and confirmed the horizontal area at the $0.200 level as a resistance. This $0.200 resistance level has been standing since 2020. The most interesting aspect that can attract investors’ attention is that this resistance is considered as the last resistance before ATH, namely the $0.770 level.

In the announcement made by LBANK, it was stated that LOOM will start trading on the futures trading platform on October 11th. A similar announcement was made by Binance Futures shortly after. The question now is whether this increase is a buy the news situation or the first move before a possible rise.
Will LOOM Enter the Top 100 Coins?
After the price increase, LOOM caught the attention of the top 100 after the market value analysis. The altcoin was ranked 107th at the time of writing. It has a circulating supply of 1.2 billion coins. Considering this supply, LOOM needs to reach the $0.215 price level to enter the top 100.
In the weekly charts, the RSI indicator indicates the direction of the increase. RSI is widely accepted as an indicator used by traders. In the RSI analysis, it is evaluated whether there is overbought or oversold for investors.
Although RSI appears in the overbought zone for LOOM, there has not been a move that could be a warning about a decline in a supportive manner. If LOOM can stay above the $0.200 resistance level, this can open the way for it and the price increase can intensify. On the contrary, a sharp price rejection that can occur in the horizontal area can trigger a 40% decline towards the declining resistance trend line, which is currently at the $0.120 level.


 Türkçe
 Español


