Bitcoin (BTC)  $103,014 and cryptocurrencies have opened doors to massive profits since their inception through four-year cycles. Currently, crypto traders are trapped in tedious price movements. This article examines predictions based on various analysts’ charts from the last decade to determine where we stand in this cycle.
Analysis by Year
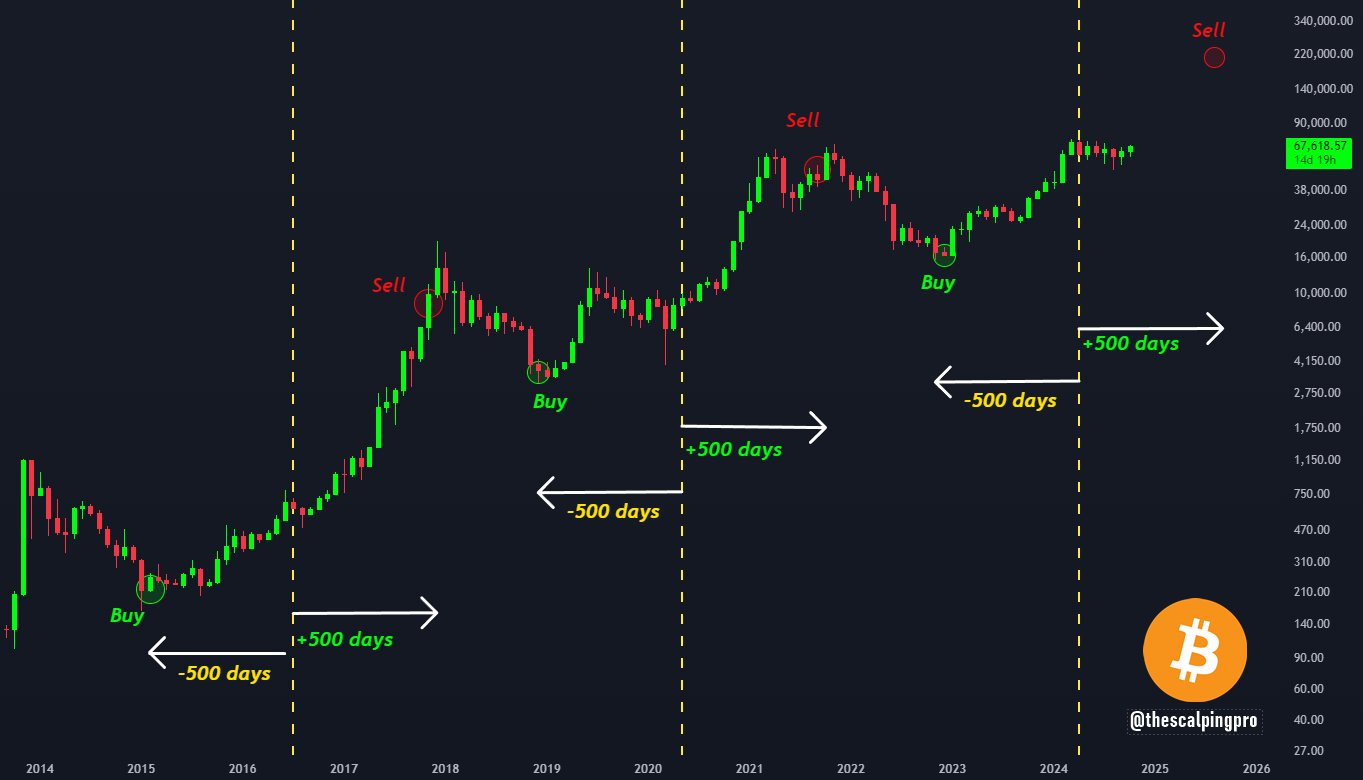
BTC was valued at $67,000 at the time of writing. Altcoins are experiencing a downturn as Bitcoin retraced from its recent peak. An analyst known as Mags shared a strategy for investors to navigate the ongoing dull price movements, based on the last ten years of data.
- Buy Bitcoin 500 days before the halving.
- Wait and don’t panic.
- Sell 500 days after the halving.
- Repeat.

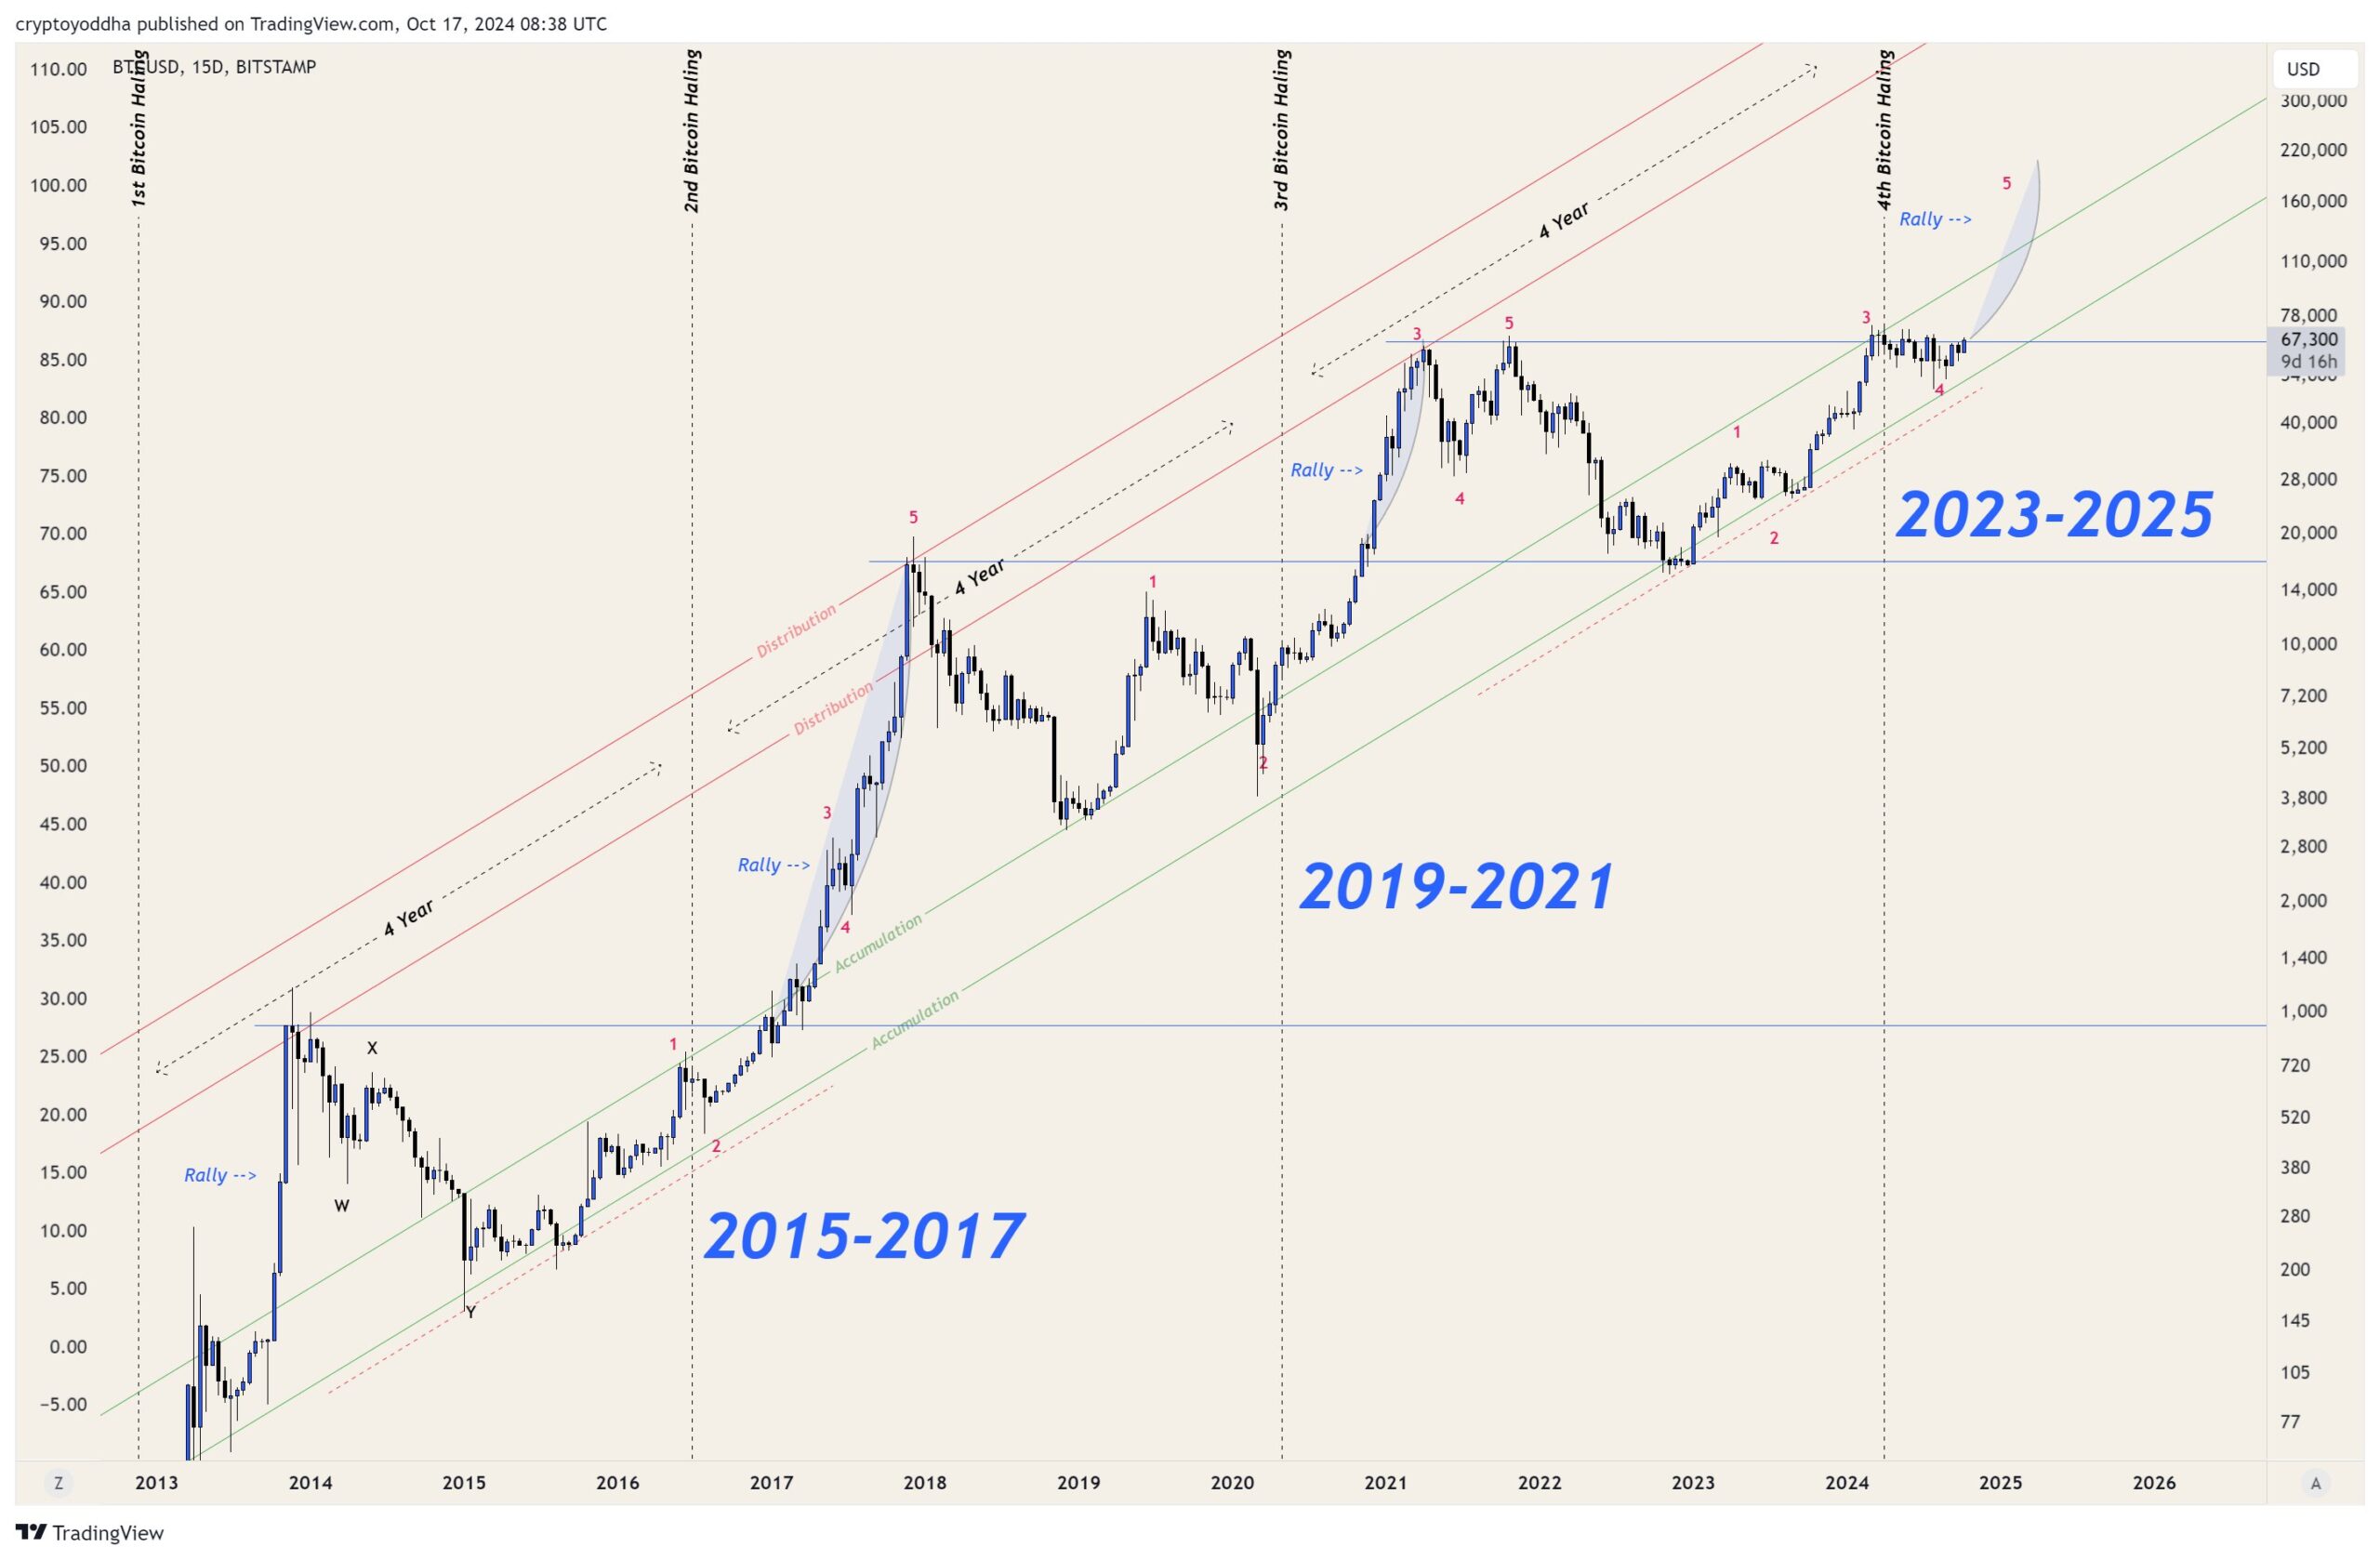
According to the analyst’s chart, we are currently in a period where selling opportunities are anticipated. Those who managed to buy at the end of 2022 might find themselves selling at around $220,000 in 2025 based on historical data. Another noted analyst, Yoddha, remarked:
“Imagine BTC sitting at the same price after dropping in half for months. The next few months will be exciting.”

His chart focuses on a five-phase process. This recurring movement is set to begin its fifth phase now. If everything progresses as anticipated, we should see prices reaching six-figure targets.
Price Predictions for Bitcoin
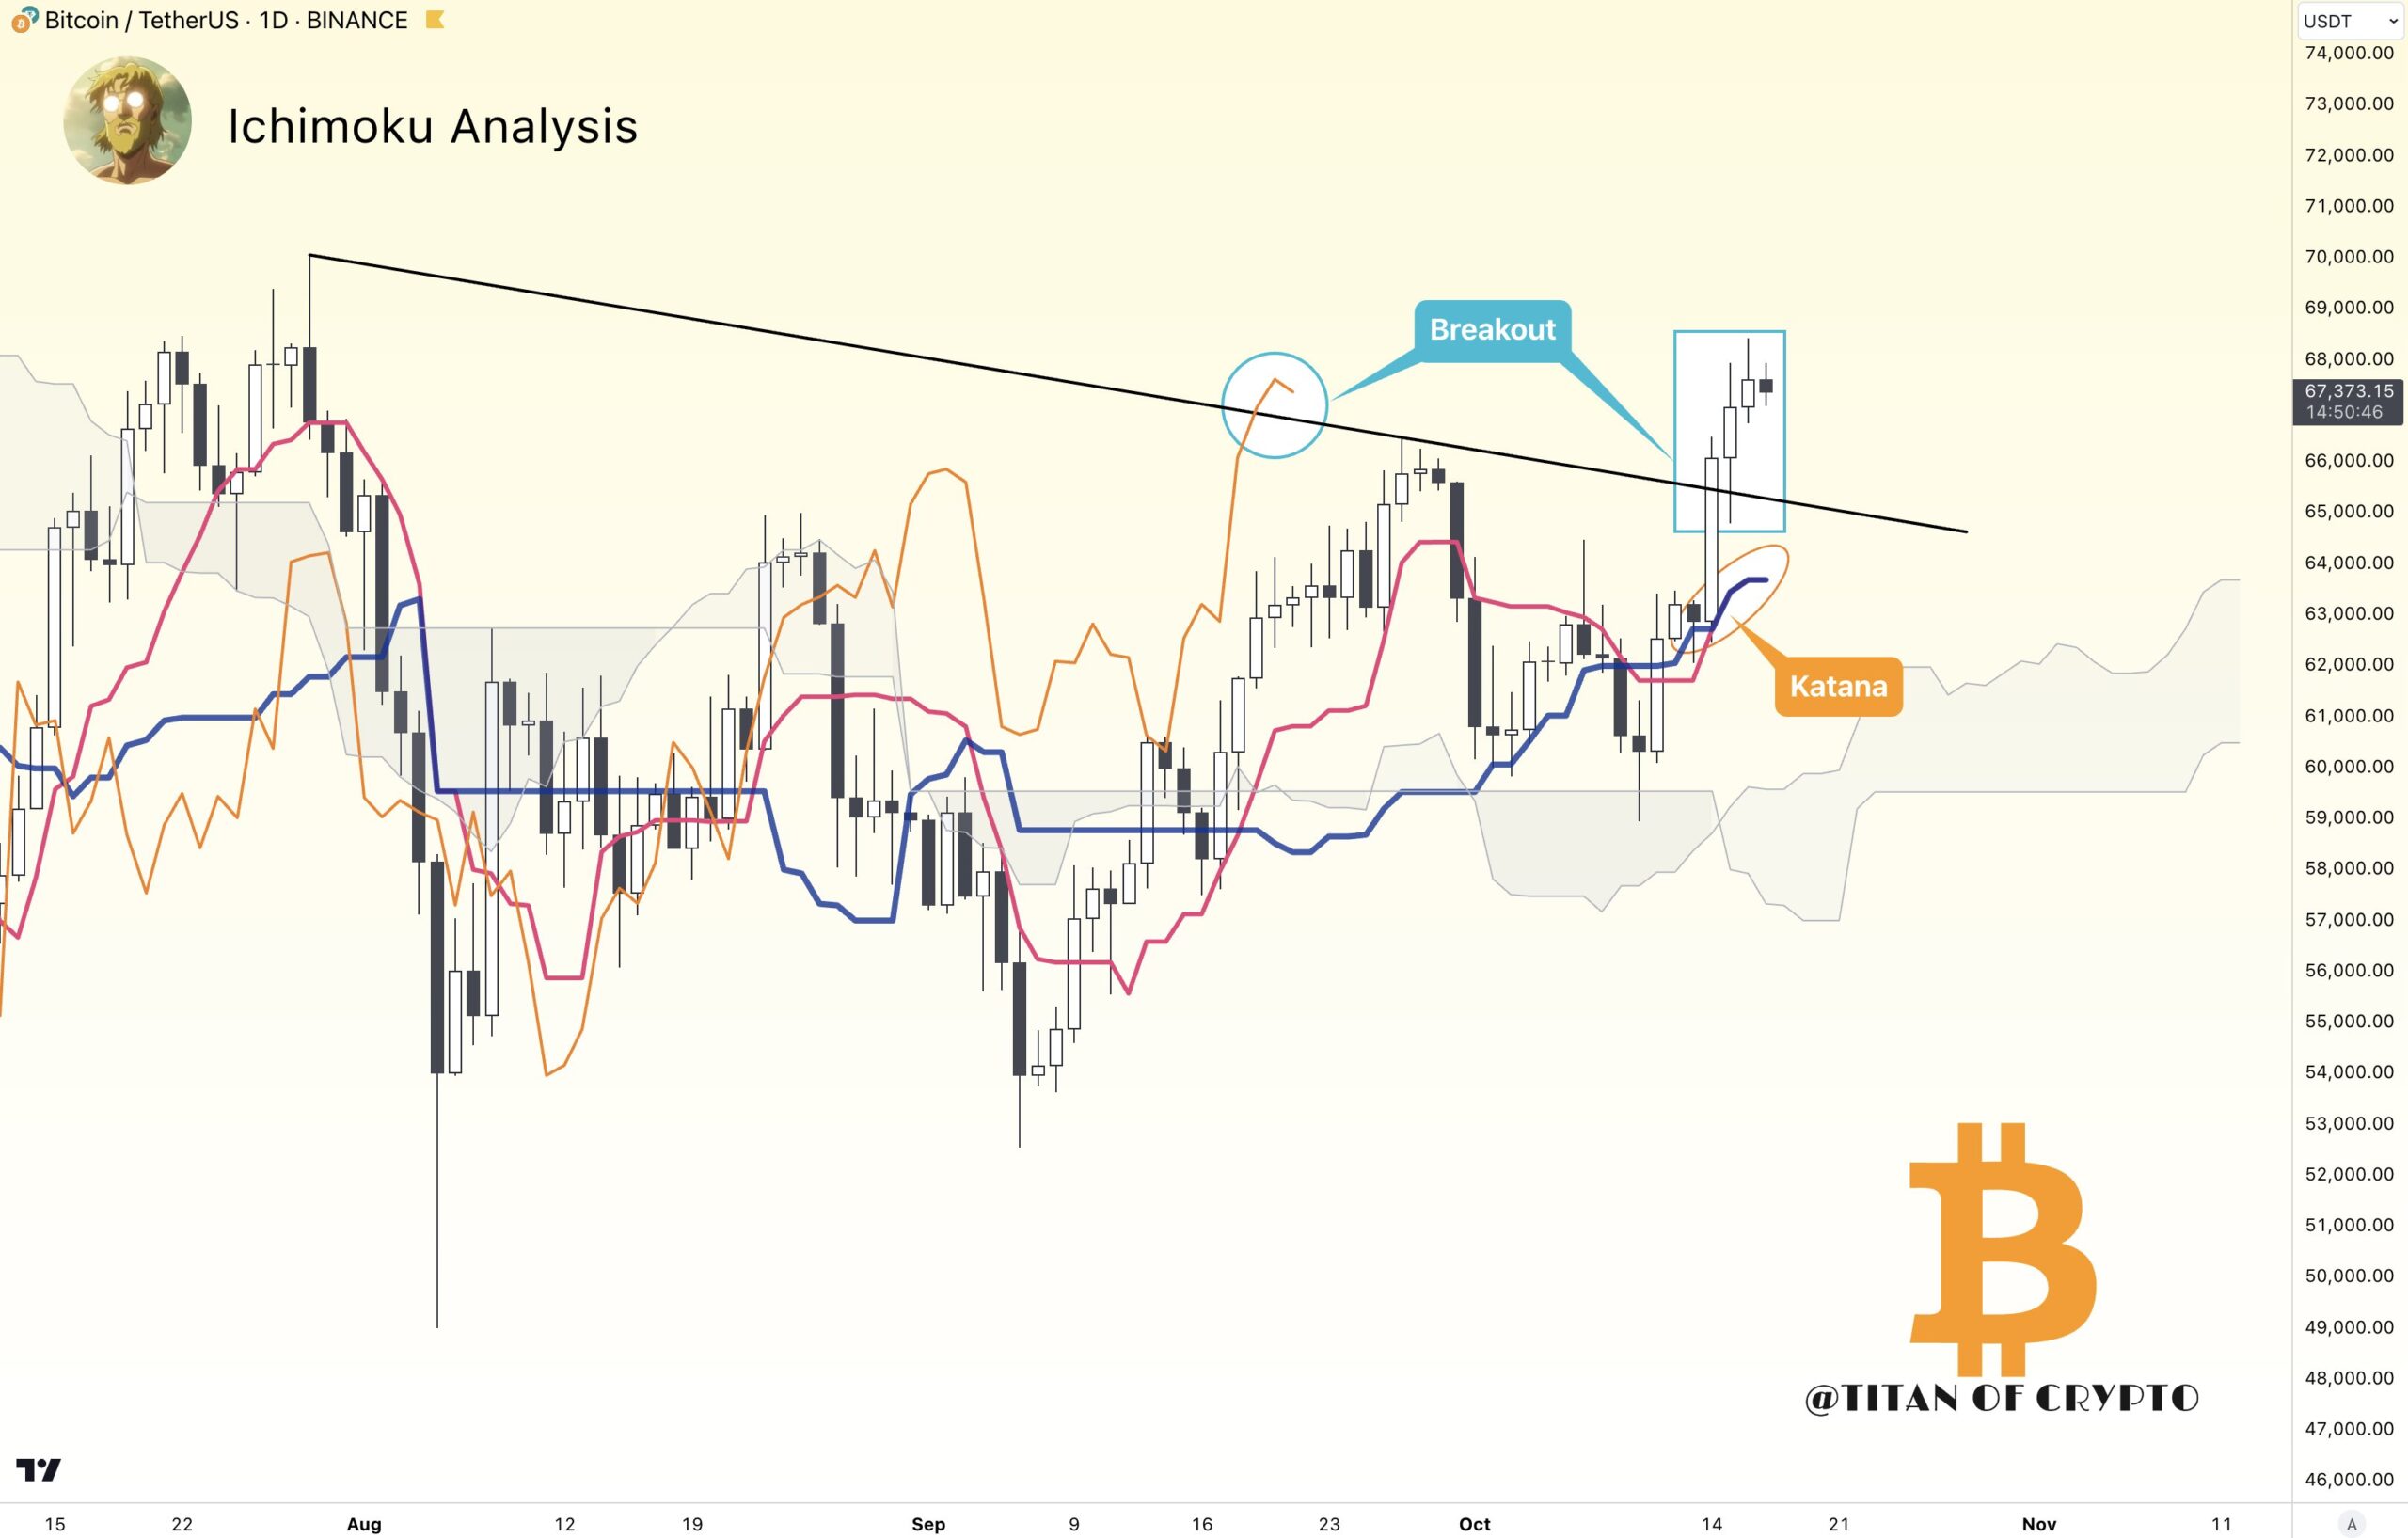
Titan Of Crypto examines the short-term outlook. The chart shared indicates that BTC could gain momentum with daily closes above $66,000. If proven correct, Bitcoin might surpass its all-time high, aiming for $80,000, which aligns with the parabolic upward movement identified in the ten-year charts discussed earlier.

“A strong trend movement has started with a newly formed katana on the daily timeframe. This occurs when Tenkan and Kijun overlap.”
“This is usually followed by a sharp break of Kijun. If Kijun follows after separating from Tenkan, it provides a strong continuation signal.”

 Türkçe
 Español


