MATIC, the token powering Polygon, saw its price drop by 10% in the last seven days. This caused it to trade near the lower line of the horizontal channel it has been following since April 13. If the bearish trend towards altcoins continues, the price risks falling below this critical support level, finding new lows.
Why is MATIC Dropping?
MATIC was trading at $0.63, its lowest price since October 2023, at the time of writing. Since April 13, its price has oscillated within a horizontal channel, trading between a resistance of $0.75 and a support of $0.64. Generally, this channel forms when an asset’s price consolidates within a specific range for a while. This occurs due to a relative balance between buying and selling pressures, preventing the price from showing a strong trend in either direction.
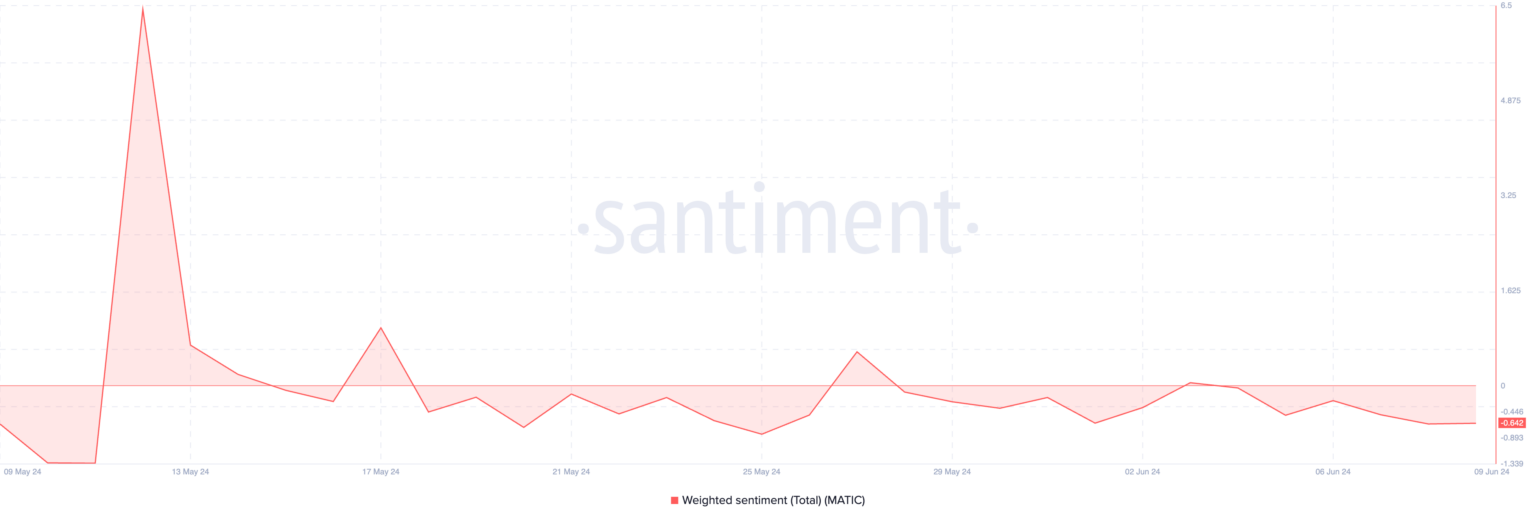
MATIC’s price movement towards the lower line of this channel last week indicates an increased bearish trend towards the altcoin. This was confirmed by the negative weighted sentiment observed on the chain. Since the beginning of the month, MATIC’s weighted sentiment has been predominantly negative. At the time of writing, this data was -0.64.

This data measures the overall positive or negative sentiment towards an asset by tracking the mentioned sentiment and volume. A weighted sentiment value of -0.64 indicates a negative trend in the sentiment surrounding the asset. There are far more negative words than positive ones. This bearish trend was also confirmed by MATIC’s declining open interest in futures. At the time of writing, this amount was $197 million, down 8% since the beginning of June.

MATIC’s futures open interest tracks the total number of open or unclosed futures contracts or positions. When it declines, more investors are closing their positions without opening new ones, which is a bearish signal.
MATIC Chart Analysis
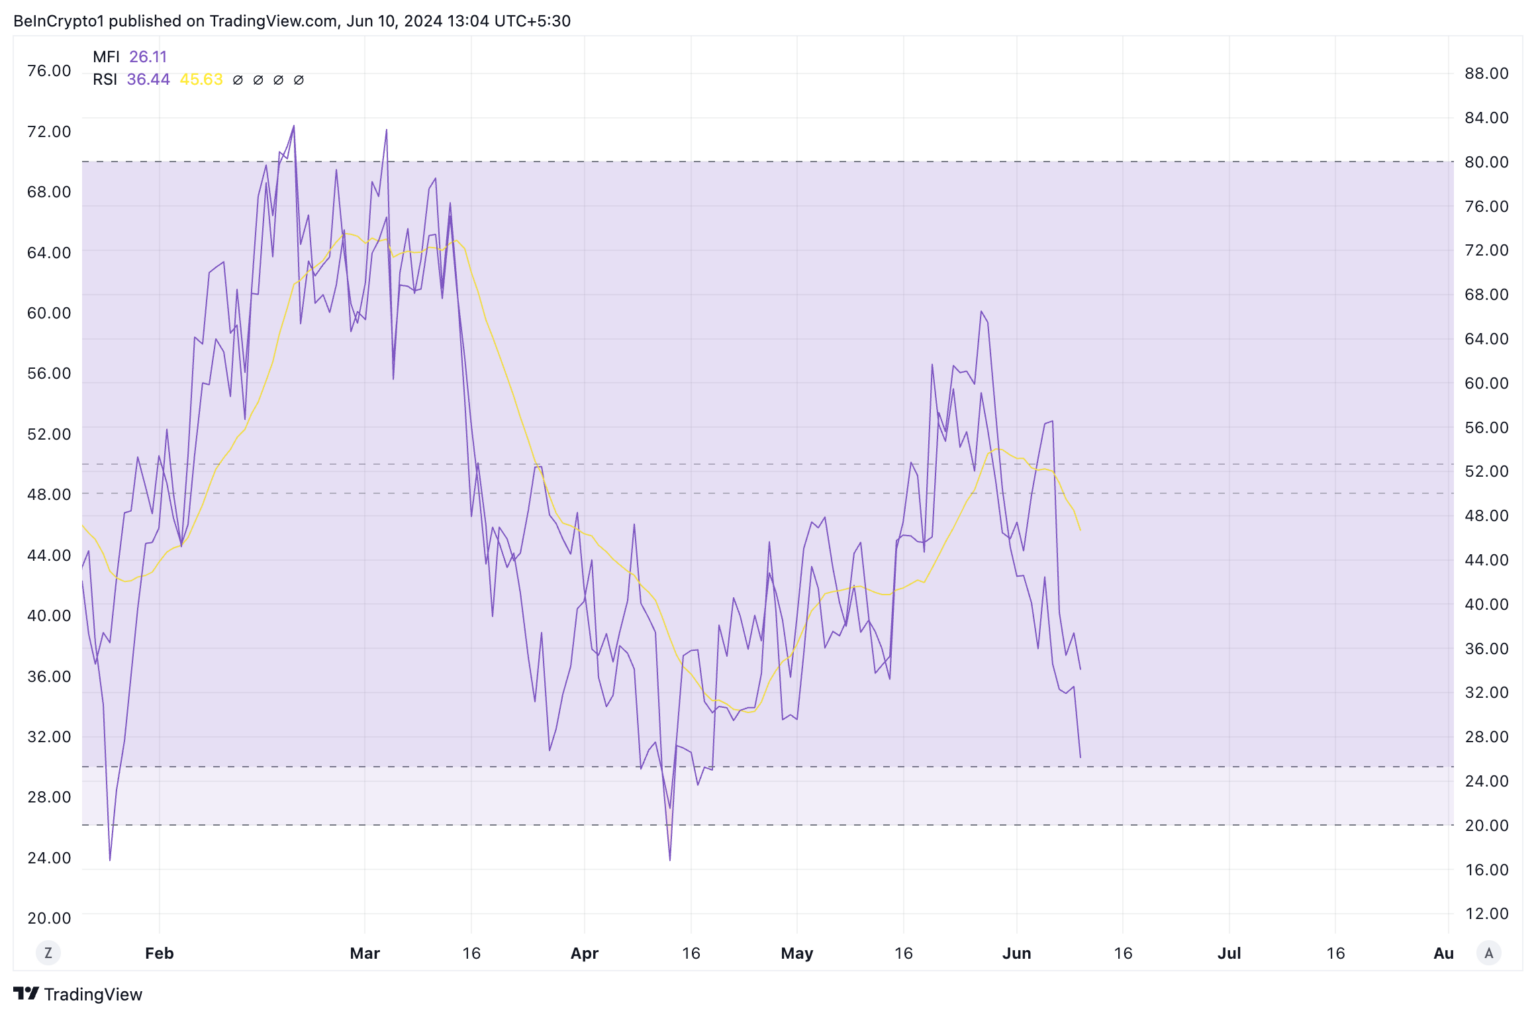
MATIC readings from key momentum indicators showed an increase in sales among market participants. For example, the Relative Strength Index (RSI) was 36.44, while the Money Flow Index (MFI) was 26.11.
Investors use these indicators to measure an asset’s price momentum and identify potential buying and selling opportunities. In these values, MATIC remains oversold as buying pressure continues to weaken.


