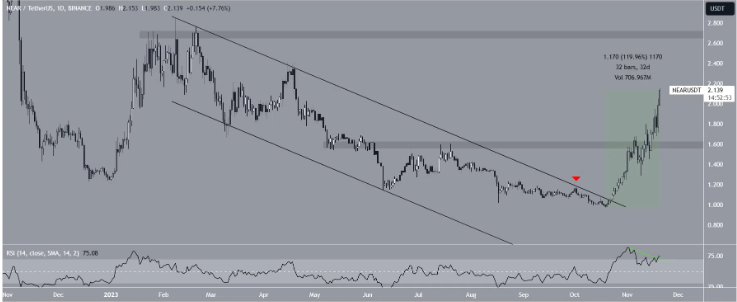
Near Protocol (NEAR) price broke out of a descending parallel channel in October, triggering this rapid surge. Following the price increase, it surpassed the $1.60 resistance area and has now reached $2.15. The question on investors’ minds is whether the price will reach a new yearly ATH.
NEAR Price is Rising
NEAR price has been declining within a descending parallel channel since the beginning of 2023. During the decline, the resistance and support trend lines were tested multiple times. After the rejection of the trend line on October 2nd (red symbol), the price dropped to a low of $0.98 on October 18th.

However, following this price movement, the altcoin quickly started rising. It has gained 120% in the past 32 days and has reached $2.15 today. The price mentioned in the news indicates the highest level seen since April 2023. NEAR broke the $1.60 horizontal resistance area during the rise and further strengthened its increase.
Market participants use the Relative Strength Index (RSI) as a momentum tool to monitor overbought or oversold conditions, accumulate or dispose of an asset.
Readings above 50 and an upward trend indicate that the bulls are still strong, while values below 50 indicate the opposite. The weekly RSI is above 50, and both positive signs are intact. Additionally, the indicator seems to have emerged from a downtrend (green).
NEAR and Analyst Comments
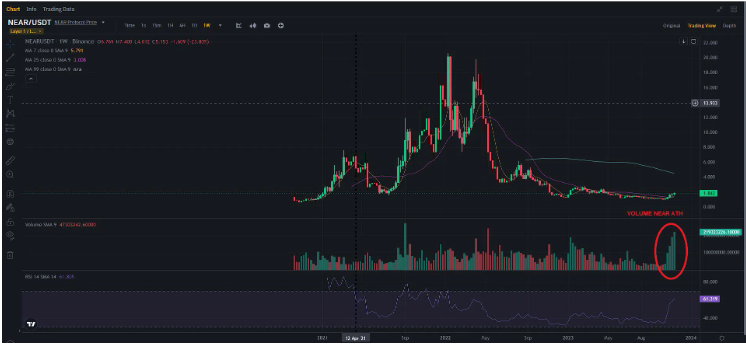
Analysts commenting on NEAR price expectations are making bullish remarks. Investmox highlighted a significant increase in long-term volume and noted that this may occur before a similar increase in price.

On the other hand, an analyst named Baba expressed less optimism about the future short-term trend and stated:
We are in the middle of a clearly defined overbought and strong resistance zone in NEAR Protocol’s $NEAR token. However, we can already predict that we have the following options. Either we accumulate in this zone and look for the next resistance around $1.9 and continue the race, or we retreat in this zone and then look for a more distant resistance around $2.1.
Future of NEAR Coin
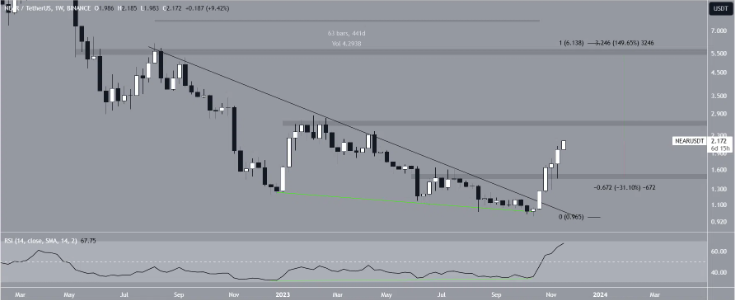
The values seen on the weekly chart provide hope for investors regarding the continuation of NEAR price increase. According to the chart, the altcoin has also broken out of the 440-day descending resistance trend line.
A significant bullish divergence was observed in the weekly RSI, which came just before the increase. Such a divergence generally occurs when a price decline is accompanied by an increase in momentum. This is followed by a reversal of the overall upward trend.
The fact that the RSI is currently above 50 also supports the possibility of such an event. The main resistance area is at $2.70. If NEAR surpasses this area, it could move towards the next resistance at $5.50 with a 150% increase. Despite this bullish NEAR price prediction, a rejection at the $2.70 resistance area could lead to a 30% drop to the nearest support at $1.50.


