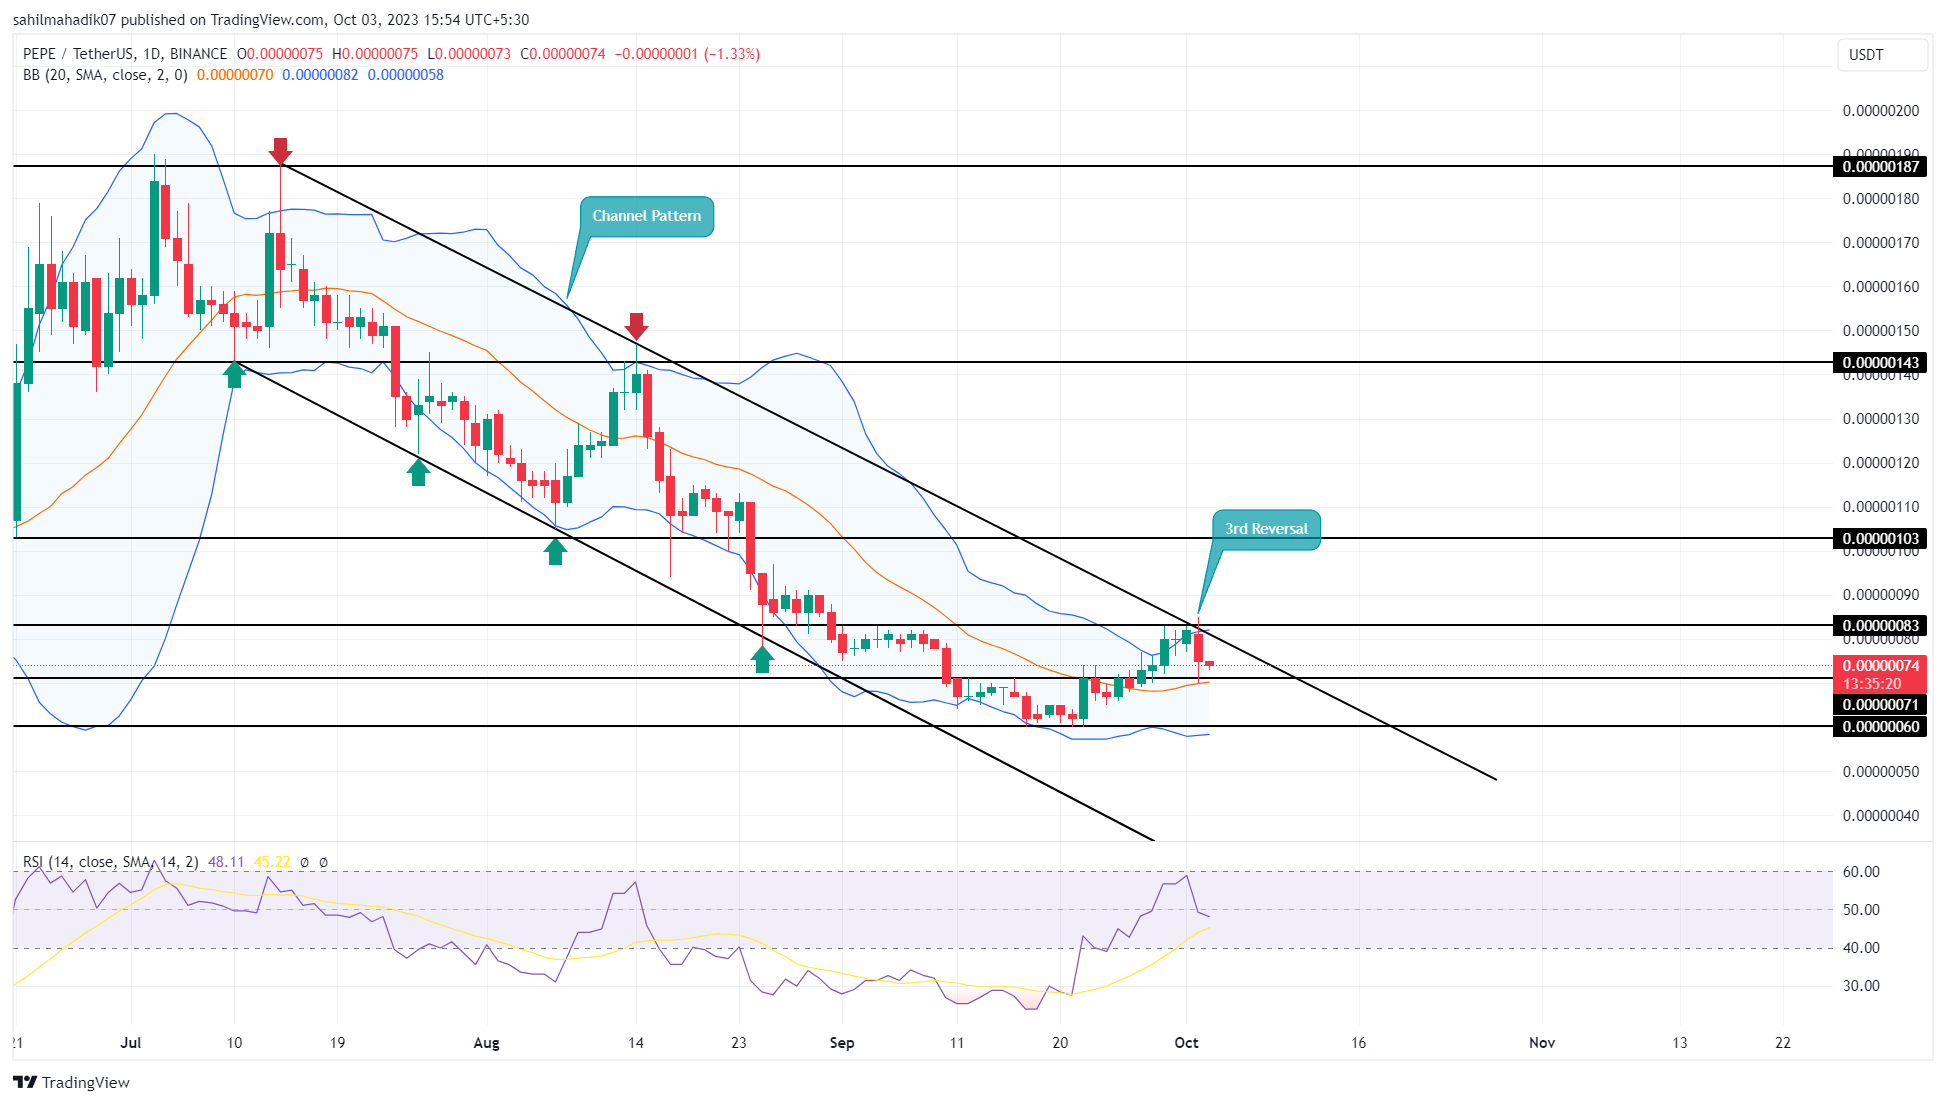
Popular memecoin Pepe (PEPE) impressively recovered all its losses from the first half of the month by the end of the last week of September. Although PEPE gained a significant profit of 37.5%, with its price rising from $0.0000006 to $0.00000083, the price rally came to a halt after facing resistance at the $0.00000083 price level and the upper trend line of the channel formation.
PEPE’s Price Chart Sounds the Alarm
On October 2nd, the price of PEPE rapidly pulled back from the resistance trend line of the channel formation. These candles, overshadowing the previous three days’ bullish candles, serve as a leading warning signal that the uptrend may reverse and a downtrend may begin.

As of the time of writing, PEPE is trading at $0.00000074, experiencing a 10.61% loss during the day and appears ready to follow a downward trajectory. If the price of the altcoin falls below the lowest level of October 2nd, which is $0.000000107, it will serve as an additional confirmation for the impending downtrend.
This situation could potentially trigger a 14% decline, resulting in a retest of the previous low level of $0.0000006. If selling pressure continues to increase, it may sustain the downtrend in the altcoin.
PEPE, DOGE, and SHIB’s Price Performance
When comparing the price movements of the top 3 memecoins, Dogecoin (DOGE), Shiba Inu (SHIB), and PEPE over the past three months, it is noticeable that PEPE exhibits higher volatility than the others. While PEPE is in a consistent downtrend, both SHIB and DOGE show more sideways movements in their medium-term trends.
Furthermore, the flattening of PEPE’s Bollinger Bands indicates that the price may face an additional resistance level and struggle to rise under more challenging conditions. The Relative Strength Index (RSI) on the daily timeframe falling below the 60 level suggests that the potential for a further decline is becoming more likely.


