COINTURK NEWSCOINTURK NEWSCOINTURK NEWS
  • Real-Time News Feed
  • Bitcoin
  • Altcoin
  • Ethereum
  • Technology News
  • Advertise
  • Contact
  • TURTURTUR
  • ESESES
Search
© 2024 COINTURK NEWS. All Rights Reserved.
Reading: Polkadot (DOT) Price Movement and Market Analysis
Share
Languages
  • TürkçeTürkçe
  • EspañolEspañol
Font ResizerAa
COINTURK NEWSCOINTURK NEWS
Font ResizerAa
Search
  • Real-Time News Feed
  • Bitcoin
  • Altcoin
  • Ethereum
  • Technology News
  • Advertise
  • Contact
  • TURTURTUR
  • ESESES
Follow US
© 2025 BLOCKCHAIN Information Technologies. >> COINTURK NEWS
Powered by LK SOFTWARE
COINTURK NEWS > Polkadot (DOT) > Polkadot (DOT) Price Movement and Market Analysis
Polkadot (DOT)

Polkadot (DOT) Price Movement and Market Analysis

In Brief

  • Polkadot (DOT) is currently experiencing a consolidation phase.

  • The price shows signs of an impending significant movement.

  • Support levels are strong, suggesting potential resistance near $9.

COINTURK NEWS
COINTURK NEWS 1 year ago
Share
SHARE

Polkadot (DOT) is currently going through a period characterized by relatively stagnant price action with minimal fluctuation around the $6 level consolidation. However, the altcoin is now at a critical point and may be preparing to stand out with the next directional movement following a potential breakout.

DOT Price Analysis

When examining the daily time frame price chart of Polkadot’s DOT, a consolidation phase marked by low volatility and a sense of market indecision around the $6 level is noticeable. This situation indicates an impending clash between buyers and sellers and shows that a significant price movement is near.

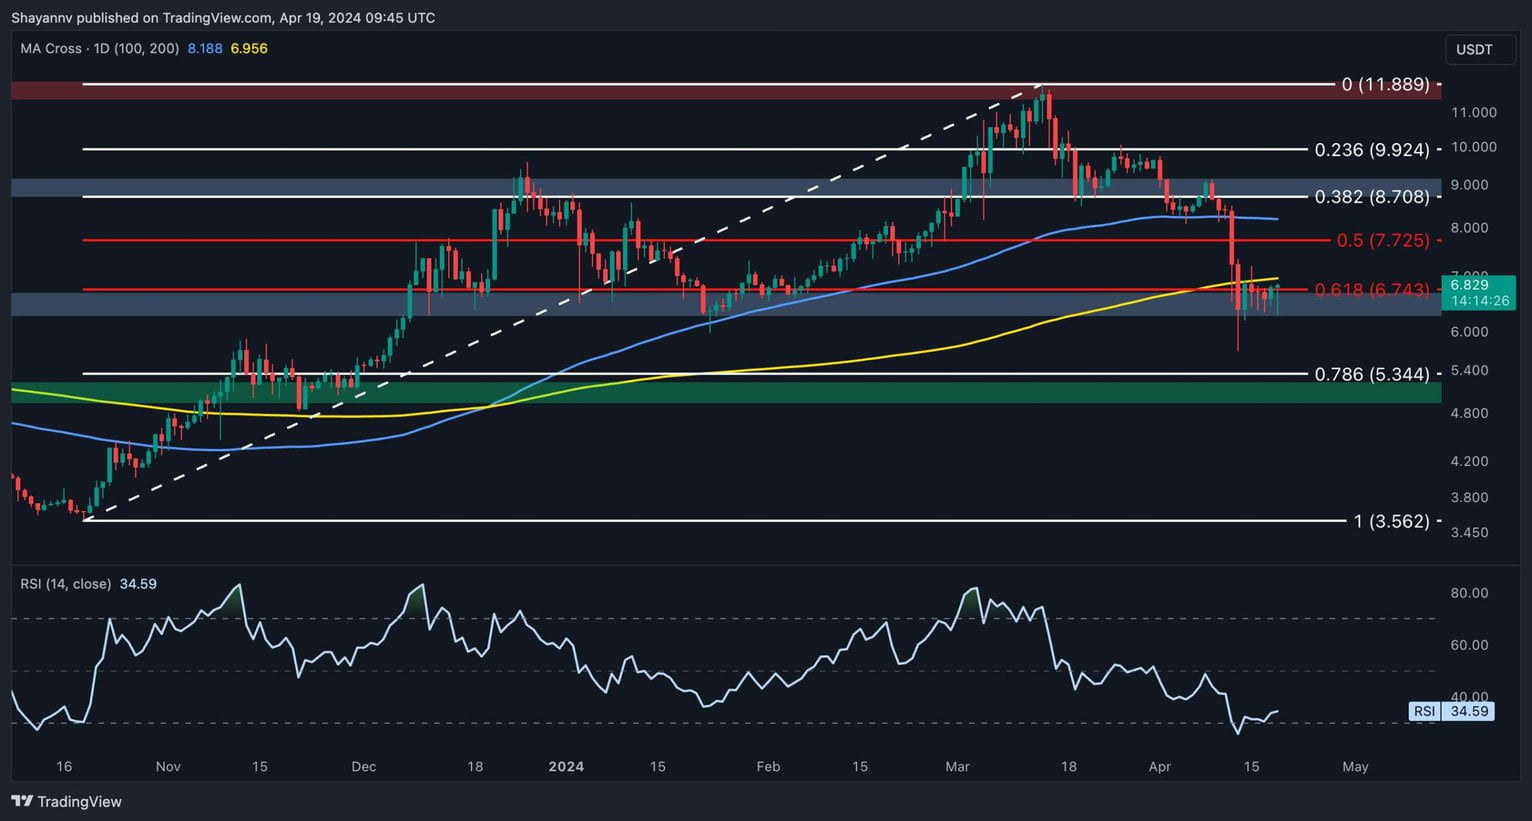
Despite this uncertainty, DOT’s price is currently drawing strength from strong support levels, especially from the 200-day moving average at $6.93 and the critical support level of the 0.618 Fibonacci level at $6.7. This challenging support region, backed by strong demand, has the capacity to prevent further downward pressure and potentially push the price towards the significant resistance area around $9.

The four-hour time frame price chart indicates a rapid descent towards the $6 level followed by a significant recovery supported by substantial demand. However, the subsequent consolidation phase may show minimal fluctuation and a lack of decisive momentum. Moreover, signs of a potential breakout from the forming triangle formation are observed, and surpassing the upper boundary line of this formation could continue the upward trend.

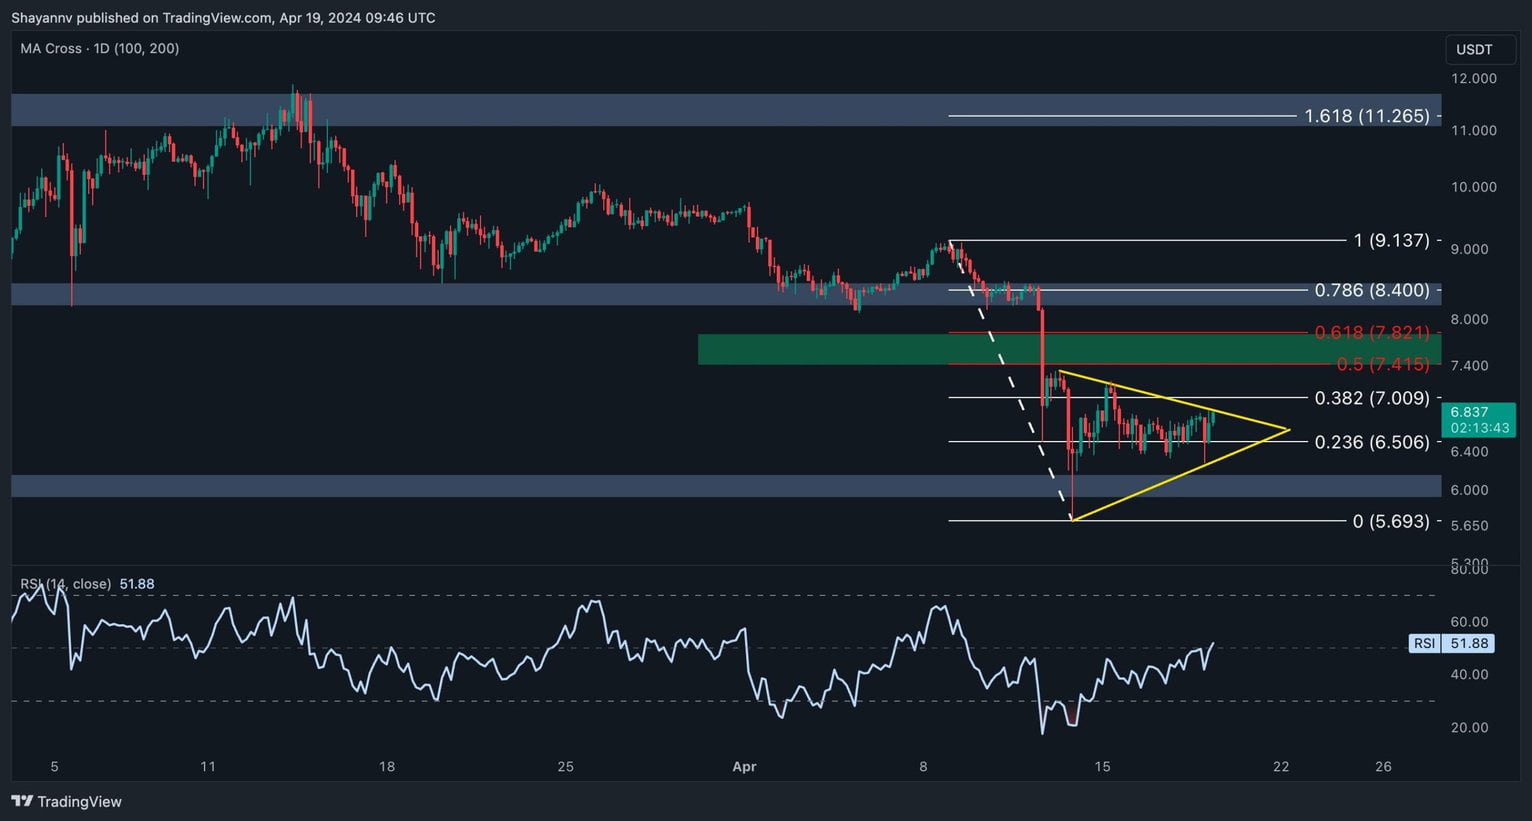
Currently, DOT is moving around the upper boundary line of this triangle formation, and an impending breakout could move the price towards the potential target range defined by the 0.5 (7.4 dollars) and 0.618 (7.8 dollars) Fibonacci levels. On the other hand, if the price falls below the lower boundary line of the triangle formation, a decline back to the $6 level could be expected.

Analysis of the Heat Map in Continuous Futures

Experts highlight the impact of DOT’s price dynamics in the continuous futures market, especially after consolidation periods, drawing attention to this aspect. Liquidation events in the futures market often drive short-term price movements, making it crucial to identify areas where liquidity is concentrated.

Currently, the liquidation heat map of the DOT/USDT trading pair on Binance‘s futures arm, Binance Futures, provides insights into likely price levels where large-scale liquidations might occur, showing that the $7 and $6 regions are significant liquidity zones. Consequently, a rise towards $7 could trigger a series of short liquidations, increasing volatility and leading to a short-term decline, while a pullback towards $6 could trigger a series of long liquidations, leading to a potential recovery.

You can follow our news on Telegram, Facebook, Twitter & Coinmarketcap
Disclaimer: The information contained in this article does not constitute investment advice. Investors should be aware that cryptocurrencies carry high volatility and therefore risk, and should conduct their own research.

You Might Also Like

SEC Extends Review Time for Grayscale Polkadot ETF Application

Grayscale Seeks Approval for Polkadot Trust, Could Boost DOT’s Market Appeal

DOT Price Surges Following 21Shares’ ETF Filing

Trump’s Comments Shake Crypto Markets as 21Shares Files for DOT Coin ETF

Polkadot Shows Significant Growth Above $8, Signaling Price Momentum

COINTURK NEWS 20 April, 2024 - 2:37 pm 20 April, 2024 - 2:37 pm
Share This Article
Facebook Twitter
Share
Previous Article UNI Token Price Aims for $10 Amid Optimistic Predictions
Next Article Cardano’s ADA Shows Signs of Recovery and New Governance Era
Leave a comment

Leave a Reply Cancel reply

Your email address will not be published. Required fields are marked *

This site uses Akismet to reduce spam. Learn how your comment data is processed.

Stay Connected

8.1k Like
21.1k Follow
1.1k Follow

Latest News

Bitcoin Surges to Power Past Gold with Institutional Boost
Bitcoin (BTC)
Ken Griffin Warns on Trump’s Policies Impacting Inflation and Employment
Economy
Coinbase Battles Massive Cyberattack: Ensures User Safety and Fortified Security
Cryptocurrency Exchanges
Crypto Markets Predict New Highs as Bitcoin and Ethereum Gear Up for Action
Technical Analysis
//

COINTURK was launched in March 2014 by a group of technology enthusiasts who believe that Bitcoin will be as important as the internet in the world of the future thanks to the amazing technology underlying it.

CRYPTOCURRENCY LIVE PRICES

  • Bitcoin (BTC) Live Price
  • Ethereum (ETH) Live Price
  • Ripple (XRP) Live Price
  • Solana (SOL) Live Price
  • Dogecoin (DOGE) Live Price
  • Cardano (ADA) Live Price
  • Chainlink (LINK) Live Price

OUR PARTNERS

  • COINMARKETCAP
  • COINGECKO
  • BITCOINHABER
  • BH NEWS
  • 21MILYON
  • NEWSLINKER

OUR COMPANY

  • About Us
  • Cookie Policy
  • Advertising
  • Contact
COINTURK NEWSCOINTURK NEWS
Follow US
© 2025 BLOCKCHAIN Information Technologies. >> COINTURK NEWS
Powered by LK SOFTWARE
Welcome Back!

Sign in to your account

Lost your password?