
The ongoing correction in Dogecoin price between two converging trendlines has led to the formation of a falling wedge pattern. The popular altcoin’s price has bounced off the lower support line of the pattern at least twice, indicating that market participants are actively responding to this chart structure. Let’s take a look at what the falling wedge pattern means for traders who have invested in DOGE or are interested in doing so.
Dogecoin Price Analysis
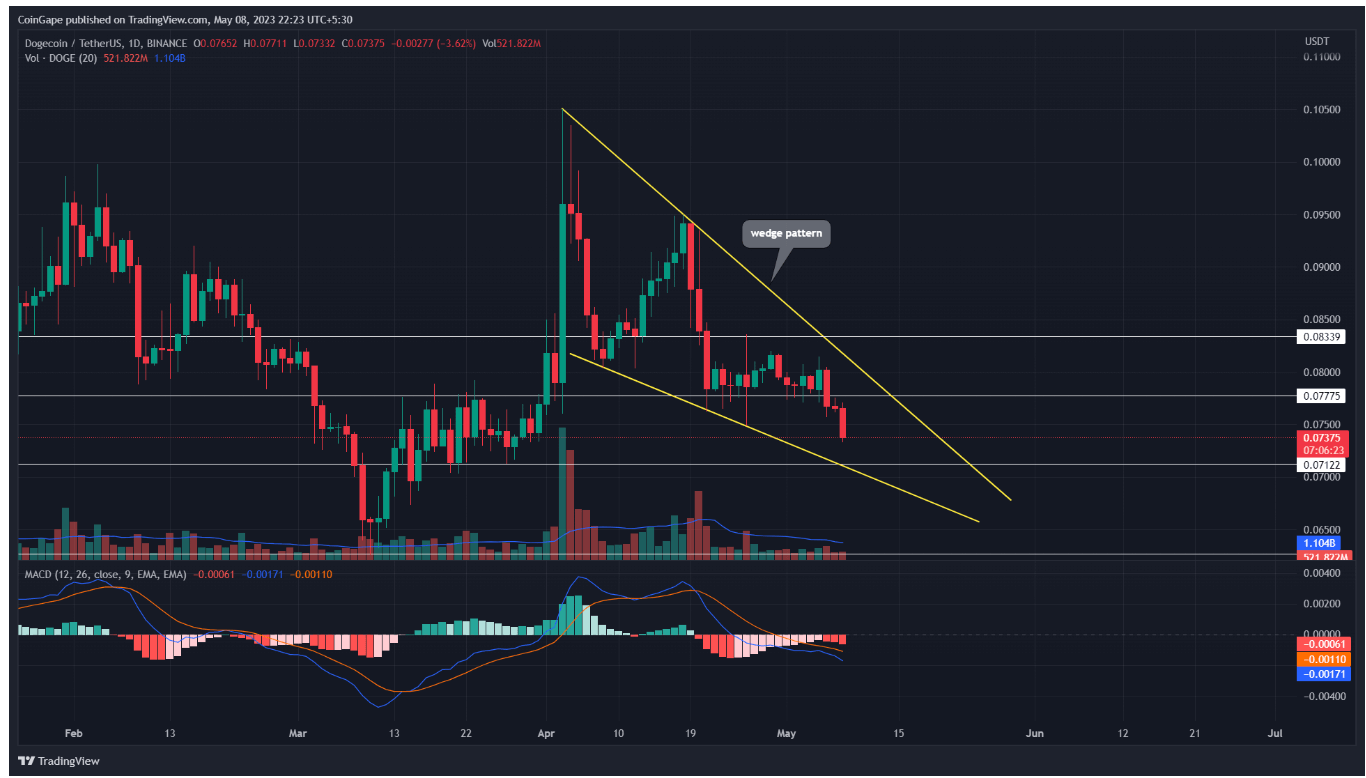
Amid an increasing sell-off for the cryptocurrency market as a whole, Dogecoin’s price fell below the $0.0777 support on the weekly price chart. With the breakout from this support, selling pressure increased, dragging the largest memecoin down by over 5 percent to trade at $0.0724.
If the decline continues, the DOGE price could fall by an additional 5 percent and touch the support trend line of the falling wedge pattern with the combined support at $0.071. Under ideal conditions, a retest of the pattern’s support trend line usually triggers a recovery of bullish momentum and a price rally. Therefore, the Dogecoin price is more likely to see a temporary rebound, which could push the memecoin up by around 8 percent to reach the pattern’s resistance trendline.
Traders would need a strong break above the resistance trendline to trigger a new rebound rally in DOGE.

What Do Technical Indicators Say About DOGE?
The Moving Average Convergence Divergence (MACD) indicator (blue) is trending down and the signal below the neutral line (orange) reflects strong bearish momentum. The 50, 100 and 200 day Exponential Moving Averages (EMAs) suggest that Dogecoin price is trading in a sideways trend.