In recent days, developments on the Bitcoin front continue to stir the altcoin market. Particularly with Bitcoin surpassing the $52,000 mark, the altcoin market keeps bringing smiles to investors’ faces. So, what’s happening on the Solana, BNB, and XRP fronts? We examine this with detailed chart analyses and key levels.
Solana Technical Analysis
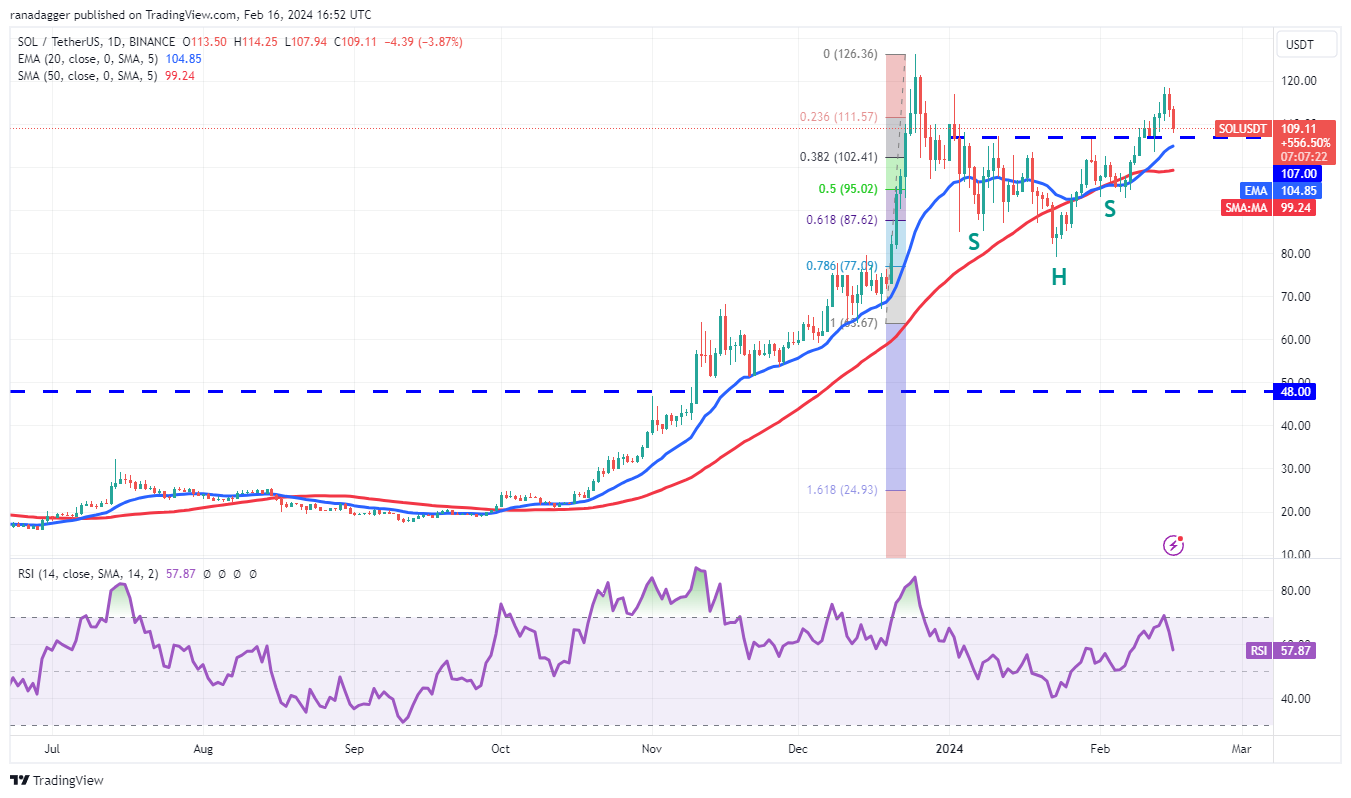
After reaching $119 on February 14th, Solana faced selling pressure and is likely to retest the $107 level, which corresponds to the neckline of an inverse head-and-shoulders formation.

If the price rebounds from the neckline, it will indicate that bulls have turned the level into support, increasing the likelihood of a breakout above $126. The SOL/USDT pair will then attempt a rally towards the $135 formation target.
Conversely, if the price drops below the neckline, it would indicate that sellers continue to offload their holdings. Buyers will try to halt the decline at the moving averages, but if unsuccessful, the pair could fall to $93.
BNB Technical Analysis
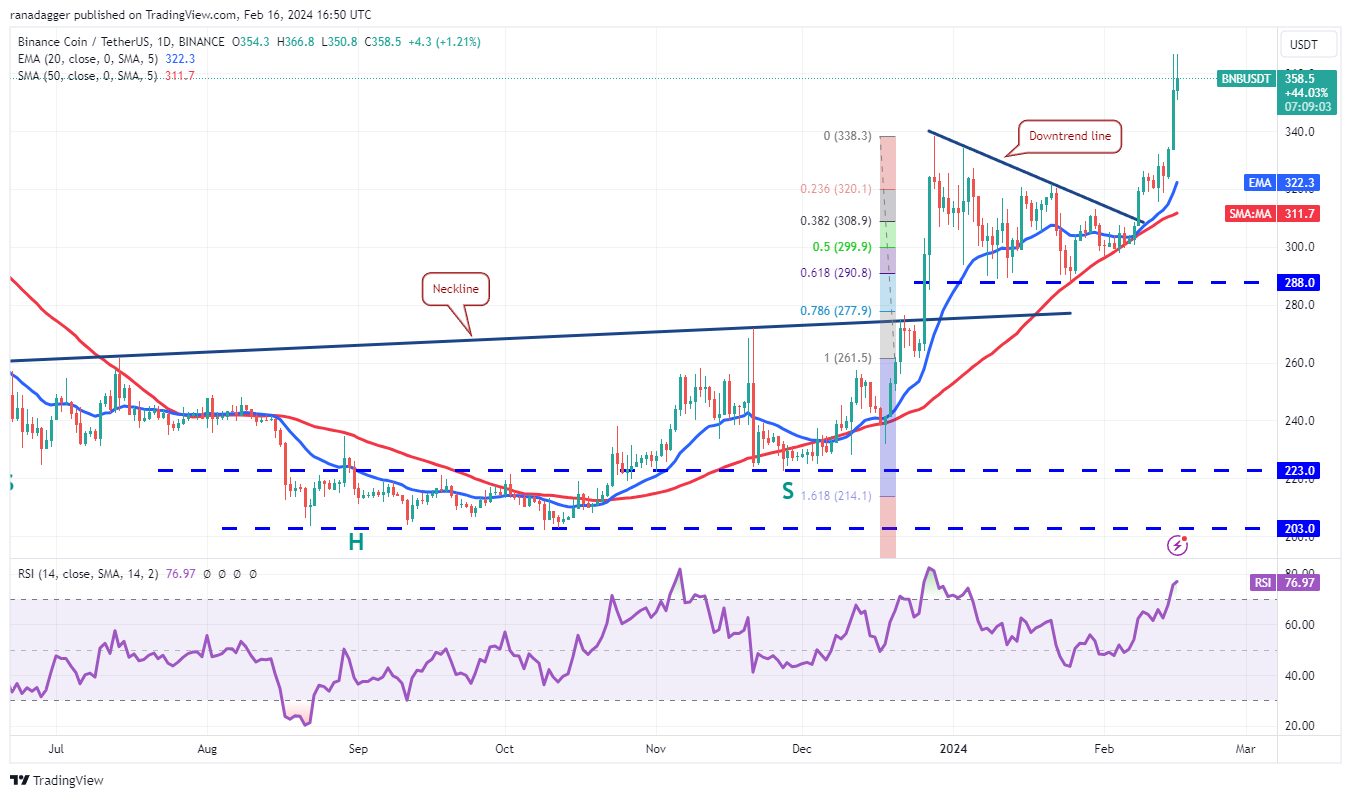
The failure of a bearish formation, as proven in the case of BNB, is a bullish signal. Buyers pushed the price above a descending triangle formation on February 8th and followed this by breaking above the overall resistance of $338 on February 15th.

The long wick on the February 15th and 16th candlestick indicates sellers trying to halt the upward movement around $366. Sellers need to push the price below $338 to weaken buyers. If they succeed, the BNB/USDT pair could fall to the 20-day EMA level of $322.
If the price consolidates near its current level, it will suggest buyers anticipate the upward movement to continue. A breakout above $366 could open the doors to a potential rise to $400.
XRP Technical Analysis
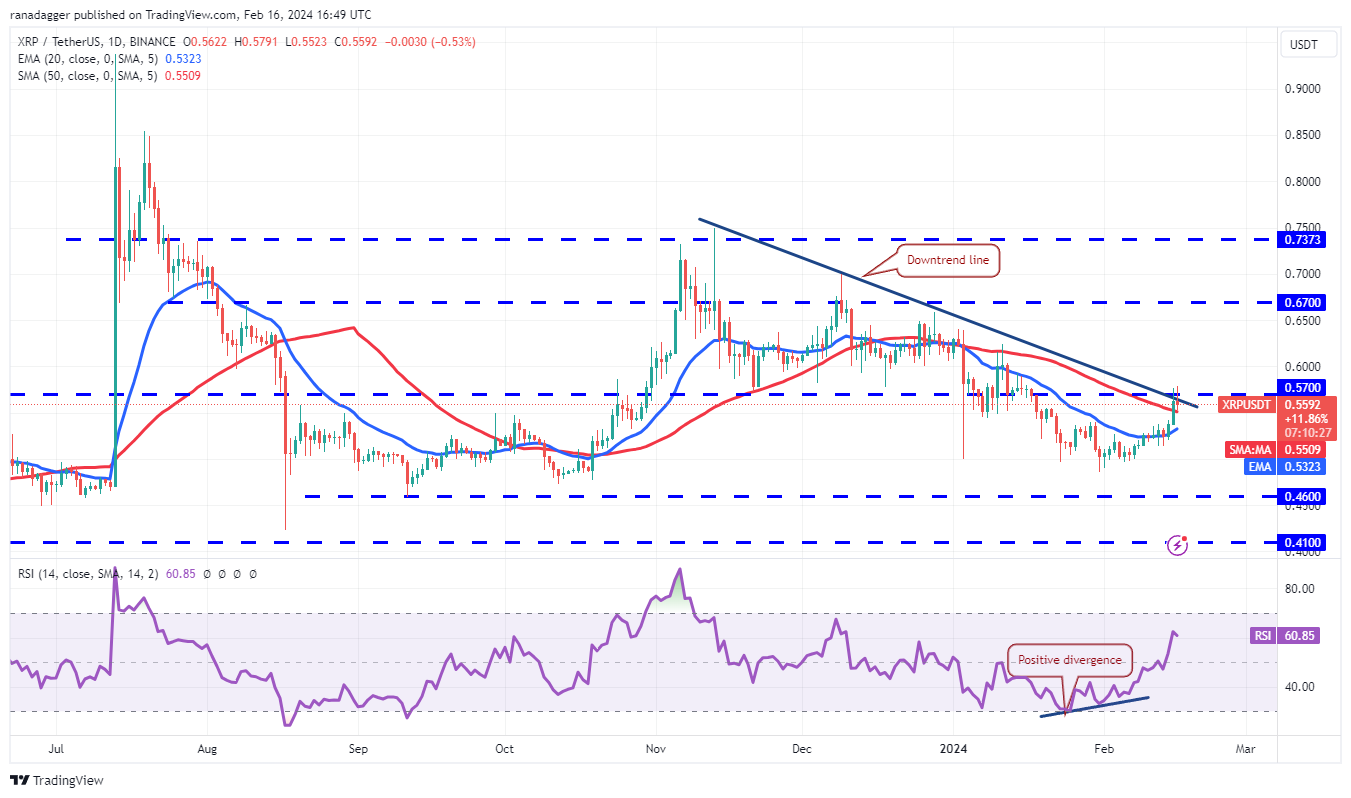
XRP turned upwards from the 20-day EMA average of $0.53 on February 14th and climbed above the 50-day SMA level of $0.55 on February 15th, indicating steady buying at higher levels.

The price has reached the downtrend line, where a tough battle between buyers and sellers is likely. If buyers prevail, the XRP/USDT pair could accelerate towards $0.67. There’s a minor resistance around $0.62, but it is likely to be overcome.
Conversely, if the price sharply declines from its current level and falls below the 20-day EMA, it would show sellers fiercely defending the downtrend line. The pair could then drop to $0.50.

 Türkçe
 Español


