Ripple’s (XRP) price movement has not been the best recently, with a value drop of 11% in the last 30 days. The price decline has also led to an increase in negative sentiment around the token recently.
Ripple’s Price Analysis
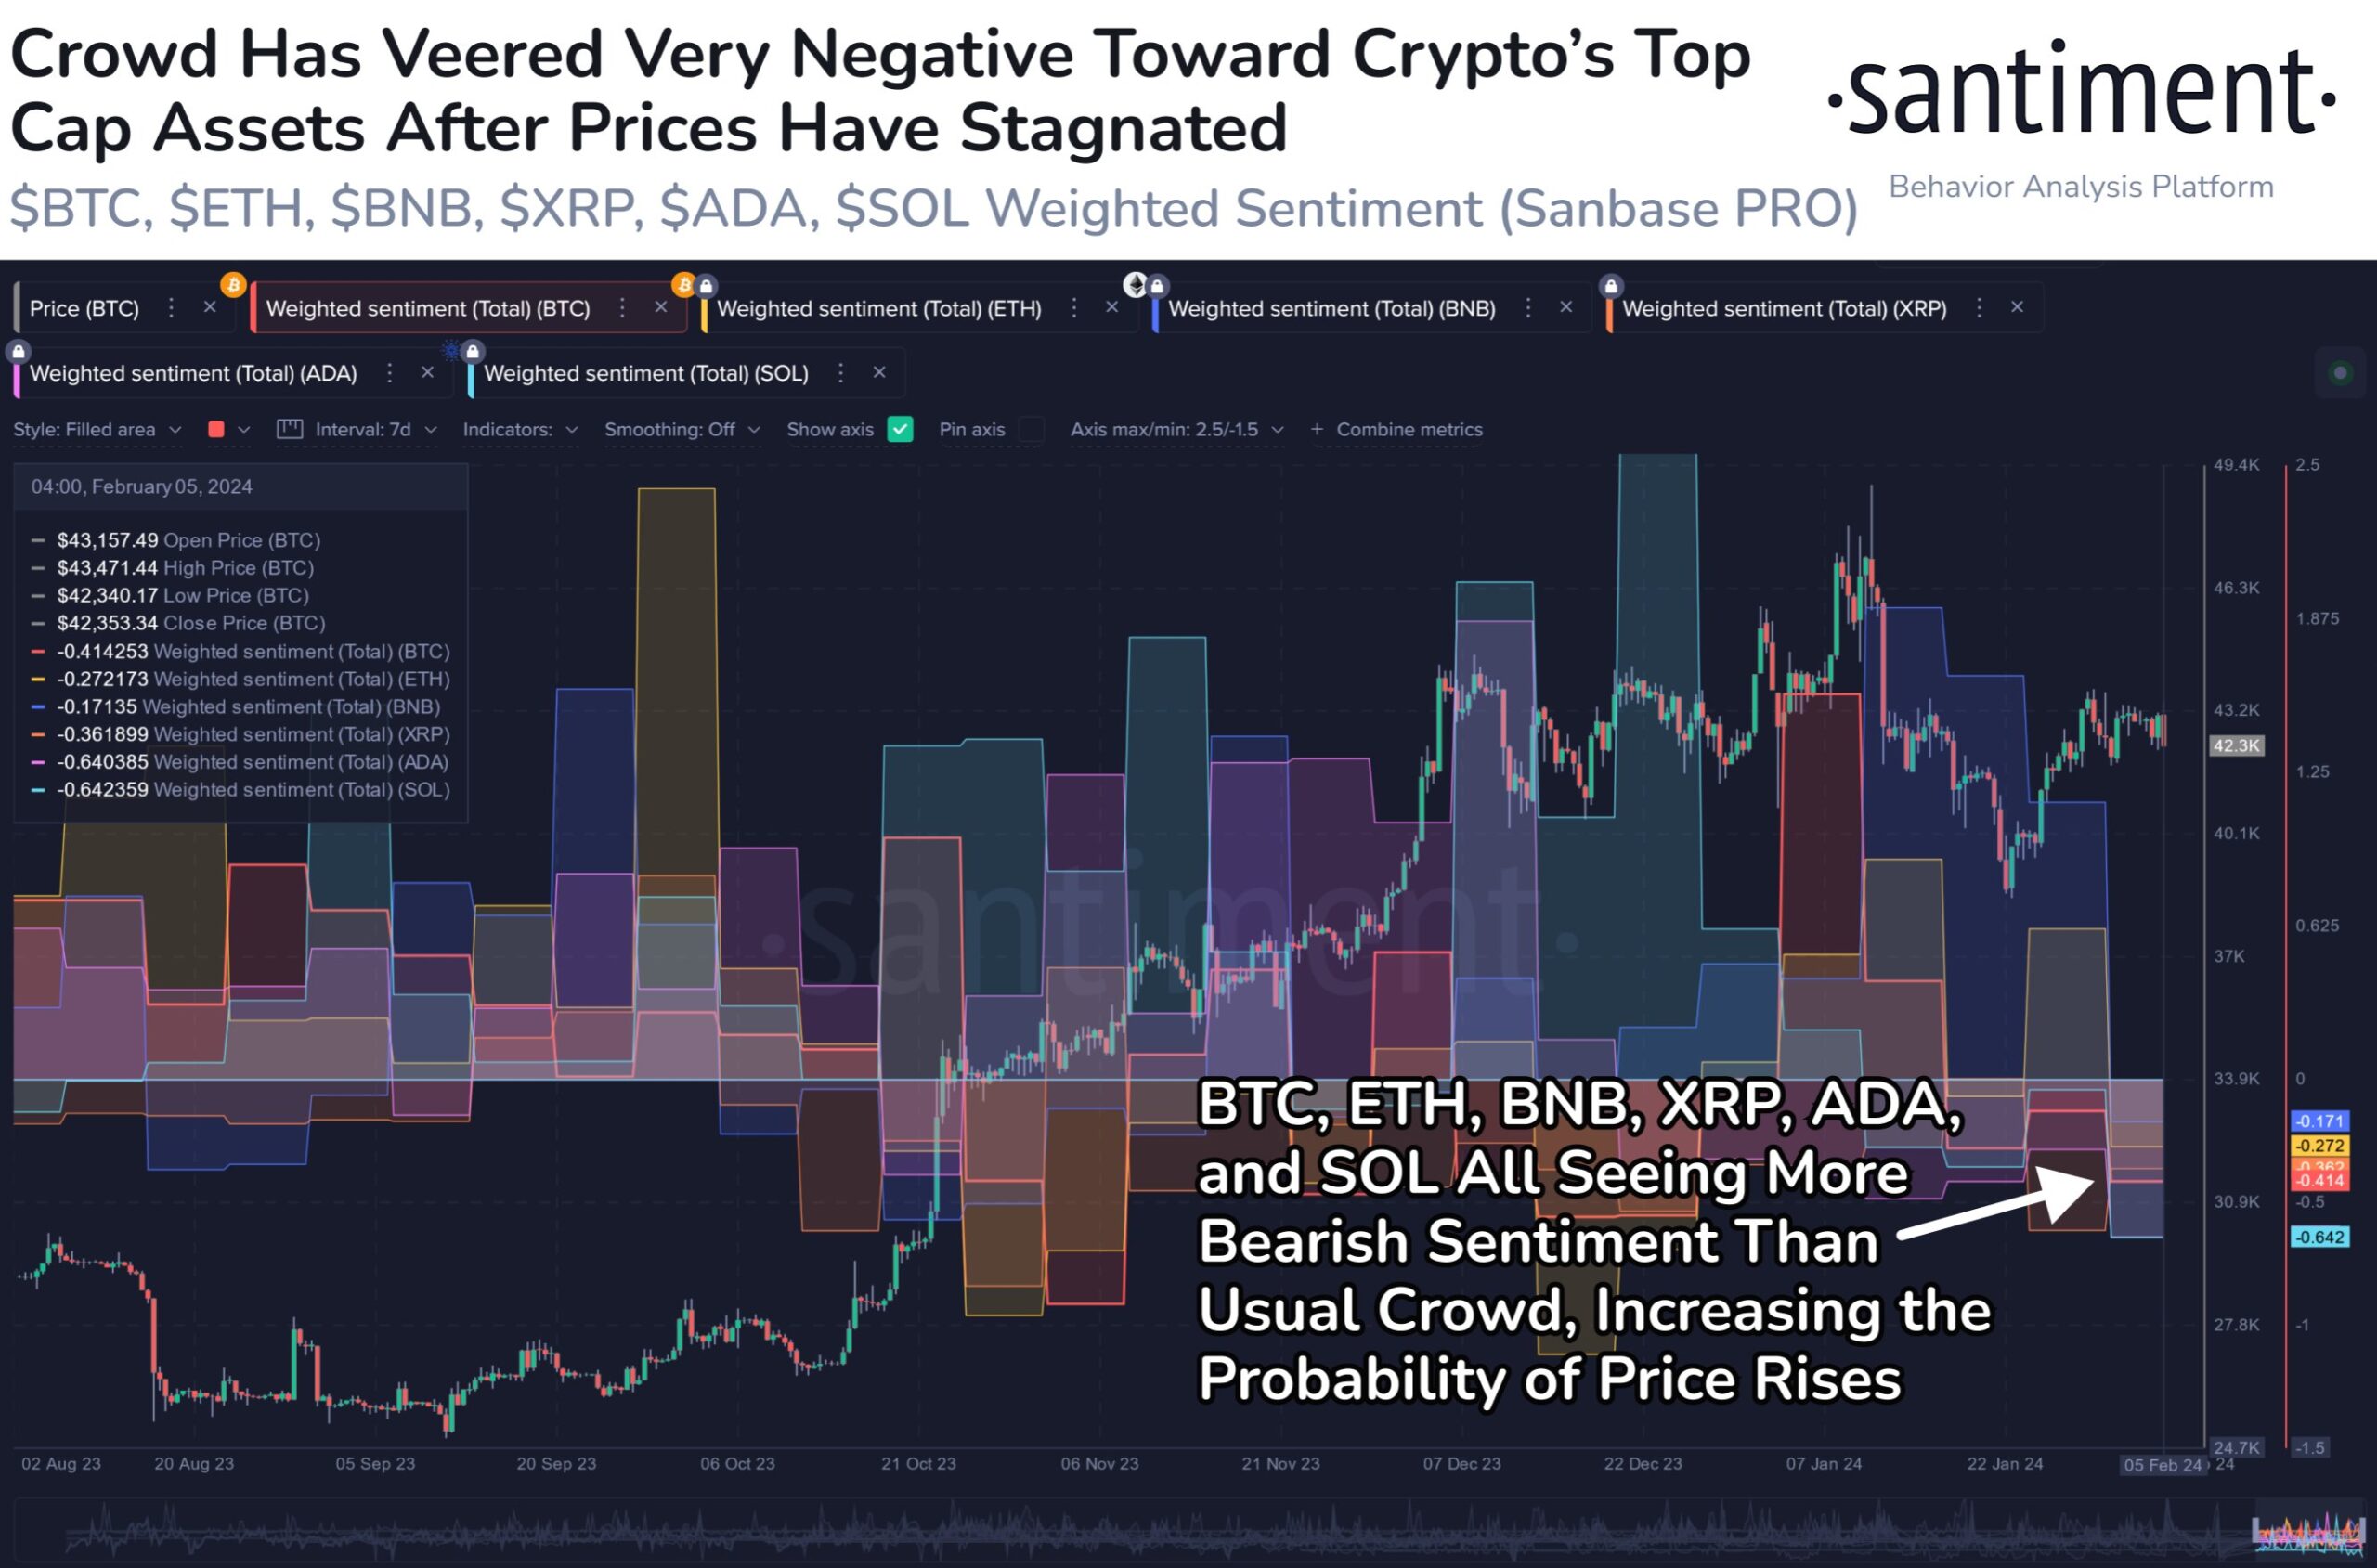
However, there was good news as some experts’ analysis suggested the possibility of a trend reversal. According to CoinMarketCap, XRP experienced a decline of over 2% in just the past seven days. At the time of writing, the token was trading at $0.5011 with a market value of over $27.2 billion, making it the sixth-largest cryptocurrency. The price drop also negatively affected the sentiment around the token. Crypto analytics firm Santiment highlighted this decline in a February 6th post. According to the tweet, XRP’s weighted sentiment was below its historical averages for the first time in over six months.
The weighted sentiments of Cardano (ADA) and Solana (SOL) have also followed a similar downward path in the past few weeks. Despite Ripple’s declining price chart, it may be surprising to see one of its fundamental indicators improving. According to experts’ analyses, XRP’s MVRV ratio has increased in the past few days. This situation indicated the possibility of a trend reversal. In addition, a popular crypto analyst named Ali also published a tweet pointing to a similar conclusion. According to the tweet, the TD Sequential indicator is giving a buy signal on the XRP weekly chart.

Current Data on XRP
The mentioned situation indicated that XRP’s price could gain upward momentum that could last several weeks. It also examined XRP’s daily chart to check if an upward trend was imminent. The token’s price was about to touch the lower boundary of the Bollinger bands, which could be a sign of a potential recovery. The MACD also indicated the possibility of an upward trend. However, the Money Flow Index (MFI) continued to record a downward trend, indicating a sustained bearish trend.


