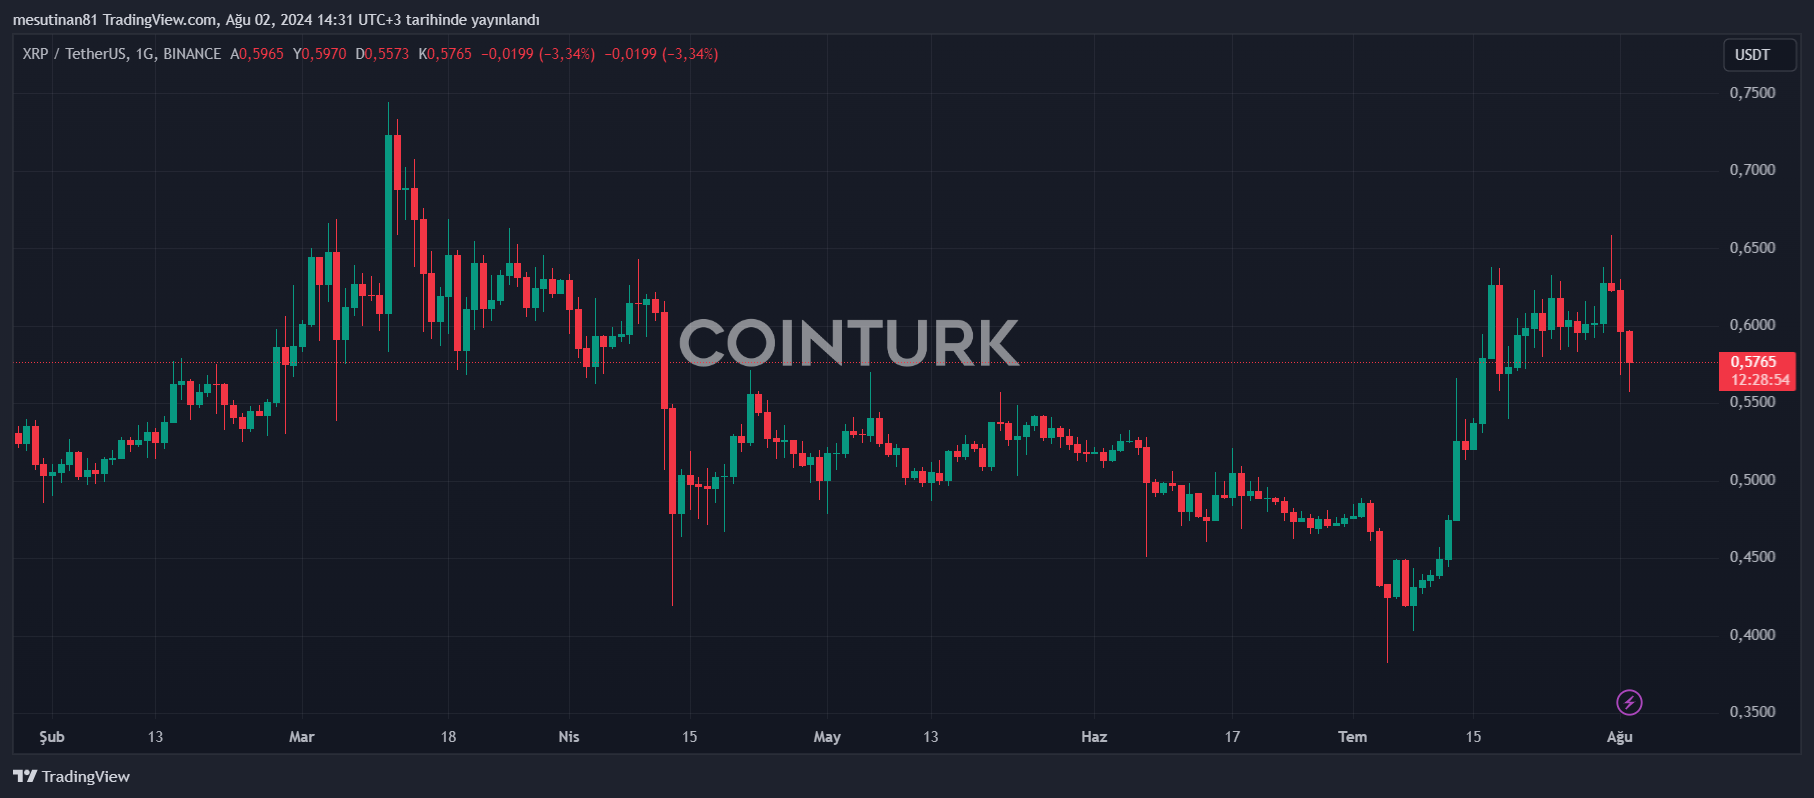
Ripple’s XRP was among the best-performing cryptocurrencies at the end of last month. Accordingly, the cryptocurrency’s price rose to a four-month high of $0.66. However, a few days ago, bears took control, and the token is currently trading at around $0.56. This represents a 7% daily drop and a 14% decrease from its local peak.
XRP/BTC Pair Declines
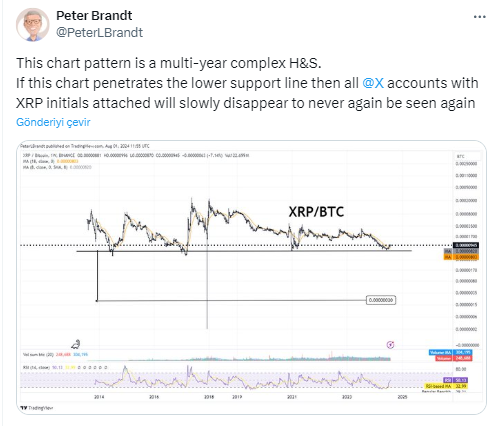
Some well-known market participants predict that XRP could experience further declines. Experienced trader Peter Brandt observed that the XRP/BTC pair has recently headed south. This decline means Ripple’s cryptocurrency XRP has underperformed compared to BTC.

Brandt also noted that the XRP/BTC price chart aligns with a “multi-year complex” head and shoulders pattern. This pattern, typically considered a bearish signal, consists of three peaks: a higher peak (head) between two lower peaks (shoulders).
Bearish Signal and Optimistic Scenarios
This pattern indicates the potential start of a downtrend for XRP price. Brandt commented, “If this chart breaks the lower support line, all X accounts associated with XRP initials will gradually disappear and never be seen again.”
Despite the recent price drop, other analysts remain optimistic. X user Dark Defender assumed that a drop to around 0.57 was the first resistance level, with the second level at 0.53. The trader claimed that XRP’s bull run could continue after breaking 0.6649. The token last traded at such high levels in mid-March 2024.

There were even more optimistic views. X user Ash Crypto, with over a million followers, predicted that XRP’s value could soar to the $3-5 range within the next 12 months. However, this trader did not base his prediction on significant indicators or technical analysis tools.
RSI Indicator for XRP
Speaking of important metrics, the RSI indicator for XRP continues to decline. RSI measures the speed and change of price movements, determining whether an asset is overbought or oversold. RSI ranges from 0 to 100, and a ratio above 70 indicates a potential price correction. Currently, the index marks 33.
XRP’s recent decline has caused concern among investors. However, some still see recovery potential. Given market volatility, predicting XRP’s future price movements is challenging, but both optimistic and pessimistic scenarios need careful monitoring.


 Türkçe
 Español


