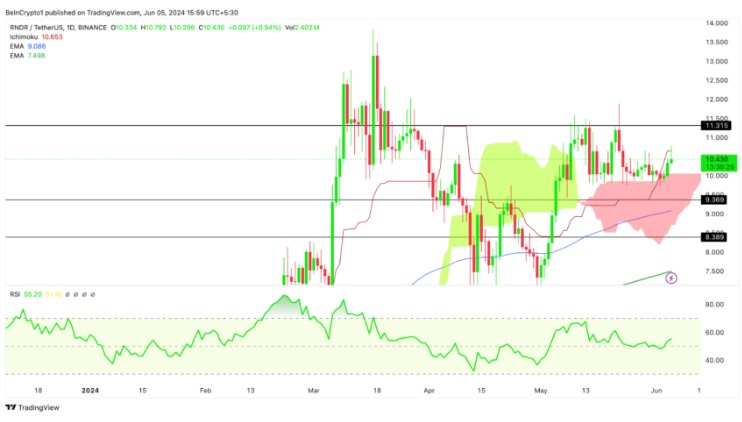
Render (RNDR), characterized by low volatility, consolidated within a narrow trading range. The 200 EMA on the 4-hour chart was a crucial support level during this period. The 100 EMA on the 4-hour chart, along with the base line of the 4-hour Ichimoku Cloud, served as significant resistance last week.
Resistance Level in RNDR
However, yesterday, RNDR’s price rose above this resistance. The token’s price tested the upper boundary of the Cloud at $10.8. The $10.8 price level could serve as a significant resistance barrier for the cryptocurrency. A break beyond this level could push the price into the $11.3 to $11.5 range.
Experts emphasized the importance of monitoring the $10.2 price level as critical resistance for RNDR. The analysis also considers whether the price will continue its upward path to encounter more resistance at $11.3. The report suggested that if Bitcoin price continues to rise to the $72,000 to $73,000 range, RNDR is likely to surpass the $11.3 price level.

Price Analysis in RNDR
In the 4-hour chart of the cryptocurrency, the RSI rose to 70 as the price traded near the $10.8 resistance level but is now falling. This indicates a potential correction is ongoing. If RNDR breaks down from the Cloud, it could change market sentiment and potentially lead to the price settling between $9.9 and $10.2. The daily Ichimoku Cloud has been a crucial support level, confirmed by price rejection. It also suggested that the bullish momentum would continue. The upper boundary at $10, which remains firm, provides strong medium-term support.
In conclusion, the analysis closely monitors the price movement around the $10.8 resistance level. A break above this level could indicate further upward potential towards $11.3 to $11.5. Additionally, investors are advised to monitor Bitcoin’s price movement, as it could influence RNDR’s trajectory. Especially if Bitcoin continues to rise towards $72,000 to $73,000 in the medium term, it could be important to follow.


