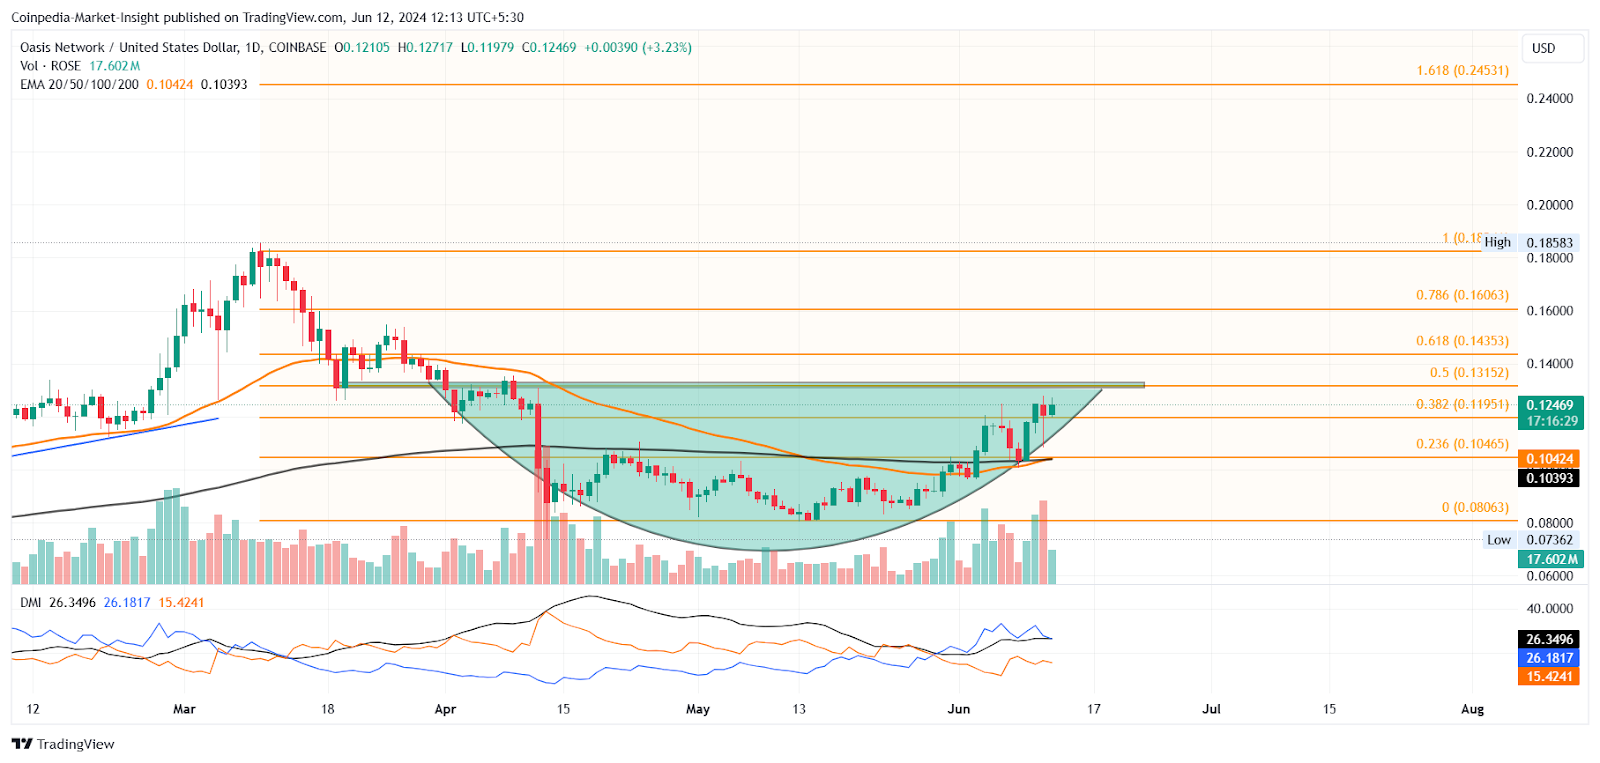
Oasis Network‘s main network asset, ROSE, is showing signs of reversing its downtrend with the formation of a rounding bottom pattern. This positive trend is further supported by the golden cross of the 50-day and 200-day Exponential Moving Averages (EMA), a classic bullish indicator in technical analysis.
ROSE Price Analysis
Despite the overall market slowdown and increasing selling pressure, ROSE‘s price trend is swimming against the tide. The reversal in ROSE’s uptrend is gaining momentum due to increased demand for the altcoin. As the altcoin exits the correction phase and enters a bullish rally, the question arises, “Can ROSE overcome its resistances?” Predictions indicate that ROSE could reach the psychological threshold of $1 this year.

Increasing buying pressure led to a significant rebound from the support level at $0.080, marking the beginning of the reversal of the uptrend for ROSE. This rebound helped reclaim the psychological level at $0.10, boosting market sentiment. The market cap of the altcoin is currently approaching the billion-dollar mark, reflecting increased investor confidence.
On the daily chart, ROSE shows a rounding bottom formation with a neckline at the resistance zone of $0.1315, corresponding to the 50% Fibonacci retracement level and becoming a critical supply area.
A bullish breakout above the 50% Fibonacci level could potentially lead to a significant rise in ROSE’s price. Currently, ROSE is trading at $0.12305 with an intraday increase of 1.86%, contributing to an approximately 50% jump over the past 30 days.
Technical Indicators Support Recovery Rally
This positive price action is supported by several technical indicators. The Directional Movement Index (DMI) shows the VI lines in bullish alignment and a rising Average Directional Index (ADX) line, strengthening the ongoing recovery rally. Moreover, the 50-day and 200-day EMAs are preparing to regain positive alignment with a golden cross, typically a signal preceding significant upward price movement.
If the recovery rally in ROSE continues, a breakout above the $0.13152 resistance will present a buying opportunity for investors. This breakout rally could take ROSE to the 78.60% Fibonacci level at $0.1606, corresponding to a potential 30% upward move.

 Türkçe
 Español


