Shiba Inu recently experienced an unusually high burn rate that had not been observed for a while. This burn rate coincided with ongoing discussions and excitement surrounding Shibarium due to recent developments. The question arises, did SHIB‘s trading volume suddenly increase or was the burn rate an independent event?
Shiba Inu Burning
According to recent information from Shiburn, Shiba Inu’s burn rate had significantly increased beyond its recent trends. Data shows that over 1 billion tokens were burned in just the past 24 hours.
Furthermore, there was a surprising increase of over 1,000% in the burn rate during the same 24-hour period. This recent increase in the burn rate had contributed to burning over 2 billion tokens in the past week. This was a significant and noteworthy development.
The Future of SHIB Coin
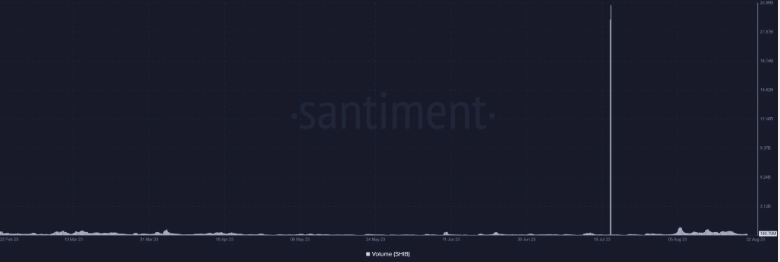
When examining the trading volume using data from Santiment, it was observed that despite the increased burn rate, there was either very little or no significant change in the trading volume. The highest trading volume for Shiba Inu occurred in July, reaching over 23 billion.
However, since then, trading activities have remained stagnant at around 108 million. This indicates that the corresponding increase in trading activity did not trigger the recent fluctuations in the burn rate for SHIB.
Uncertainty in Shiba Inu
As of August 19, the lead developer of Shiba Inu, Shytoshi Kusama, reported that work on the Shibarium project is actively ongoing within the Shiba community. This update came after the initial launch faced challenges resulting in a few hours of delay in block production.
Subsequently, on August 22, another blog post by the lead developer reported successful optimization of Shibarium. The blog post highlighted other developments and mentioned ongoing tests for the L2 platform. Although no specific relaunch date was provided, the absence of such information does not seem to diminish the enthusiasm within the community.
Potential Price of SHIB
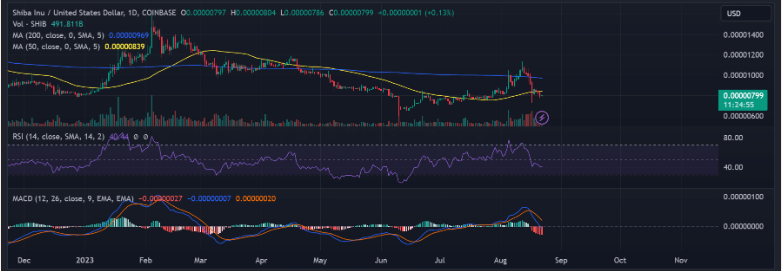
In recent days, Shiba Inu (SHIB) has experienced a notable decline evident on the daily timeframe chart. The chart showed a consistent decline starting from August 13, punctuated by occasional pauses.
At the time of writing, SHIB was trading with a marginal gain, albeit below 1%, which appeared to be a slight recovery from its significant losses. Additionally, the Relative Strength Index (RSI) for SHIB was at 40, indicating a continuing downward trend.

 Türkçe
 Español

