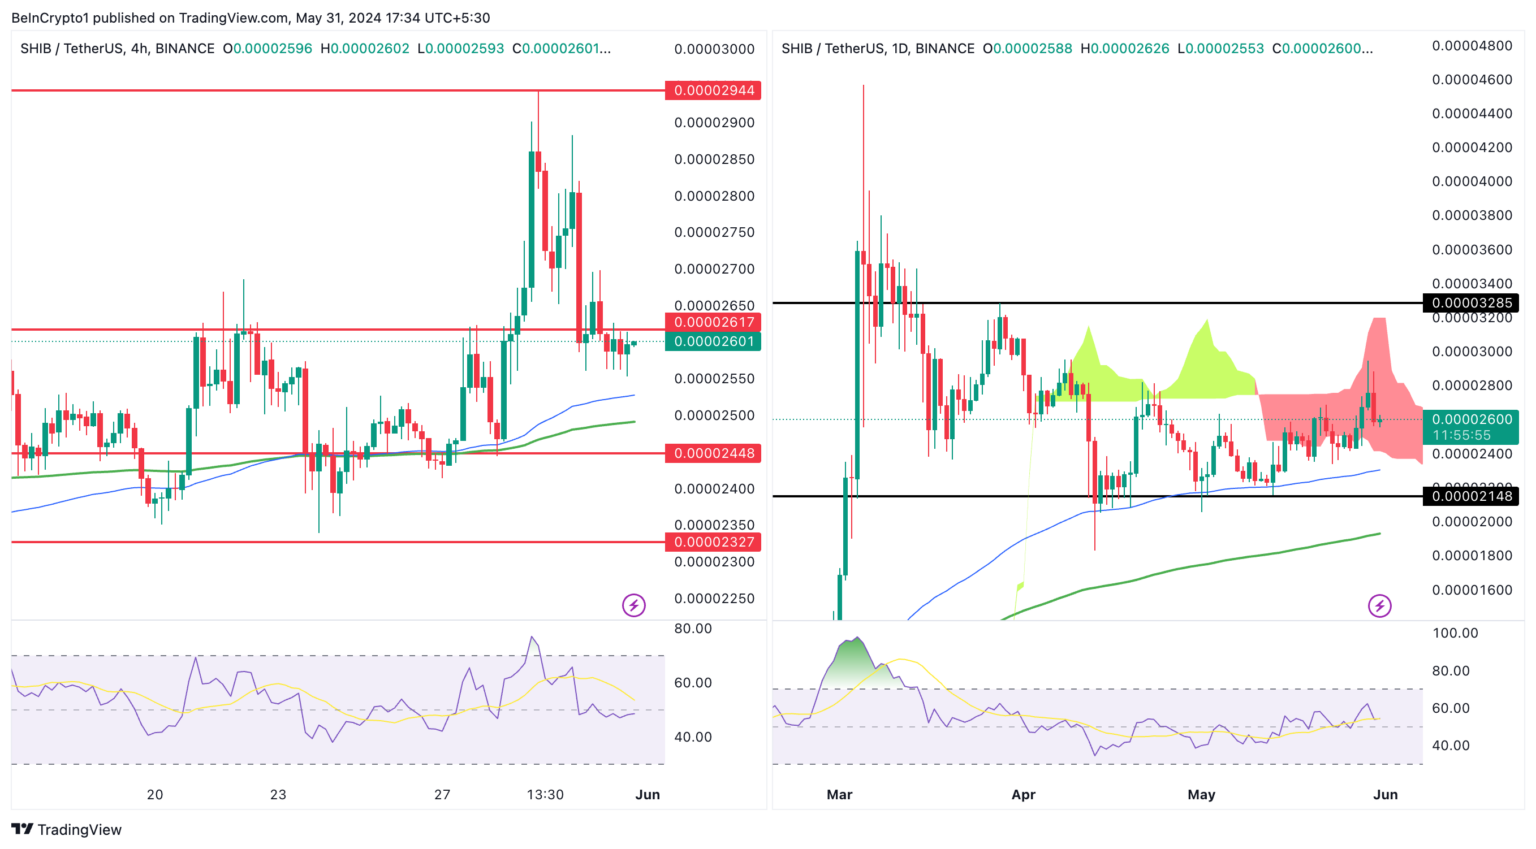
Shiba Inu has been experiencing a volatile period recently, with mixed signals in medium and long-term charts. This comprehensive analysis examines the current price movement and technical indicators to provide investors with a clear view and also reviews recent liquidation data to understand market sentiment and offer strategic recommendations for navigating the SHIB front.
SHIB Chart Analysis
SHIB is currently experiencing high volatility without a clear direction. It hovers around the resistance level of $0.00002617 and finds support around $0.00002448. The immediate resistance level is $0.00002617. Breaking above this level could signal a short-term upward movement towards $0.00002944.

Conversely, the primary support level is $0.00002448, and a drop below this level could lead to further declines towards $0.00002327. SHIB is in a horizontal trend on the daily chart and is trading within the Ichimoku Cloud, indicating indecision.
The top of the Ichimoku Cloud indicates immediate resistance at $0.00003200. Breaking above this level could target $0.00004500. Conversely, the primary support is around $0.00002300, which coincides with the 100-day EMA and the lower boundary of the daily Ichimoku Cloud. Falling below this level could indicate a continuation of the bearish trend.
Notable Data
The chart shows the liquidations of Shiba Inu trading positions categorized as long (green bars) and short (red bars) over a certain period. On May 30th, there were sudden spikes in long liquidations, indicating significant downward pressure at that time.
Short liquidations are generally less frequent but saw notable increases, especially towards the end of May. Recently, the dominance of long liquidations indicates a bearish trend in the market. Investors expecting the SHIB price to rise were caught off guard by price drops, leading to the liquidation of long positions.


 Türkçe
 Español


