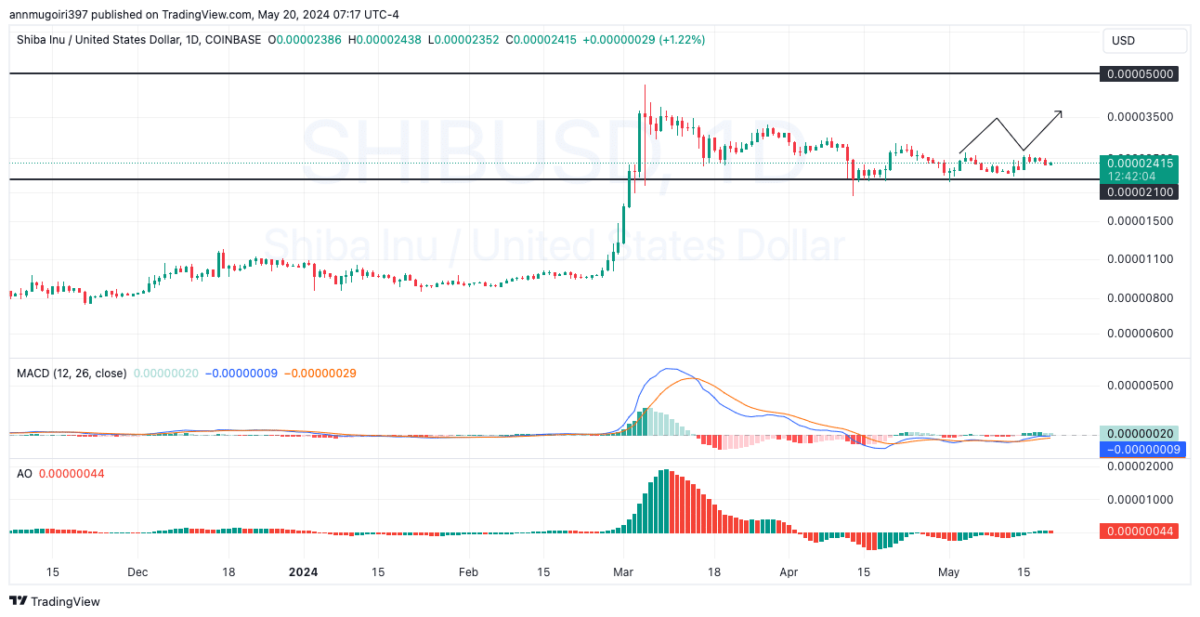
Popular memecoin Shiba Inu (SHIB) saw a significant value loss in the last 24 hours, with the price dropping by 2.72% to $0.00002409. Despite this drop, the trading volume increased by 22.16%, reaching $389.66 million. Shiba Inu’s market value is currently at $14.19 billion, ranking 11th among the largest cryptocurrencies. The altcoin has a total supply of 589.52 trillion SHIB and a circulating supply of 589.27 trillion SHIB.
Token Burn Rate Increased by 500%
Throughout the past week, Shiba Inu’s price fluctuated between $0.000024 and $0.000023, showing no clear trend but signaling bullish tendencies within narrow limits. Despite the recent price drop, SHIB saw a more significant rise of over 6% in the last seven days, with a 3.9% increase throughout the week. This indicates relative stagnation but also suggests growth periods amid market fluctuations.
One of the most critical factors affecting SHIB’s price recently has been the increase in the token burn rate. According to Shibburn‘s data, with 9.83 million SHIB burned in various transactions, the popular altcoin‘s token burn rate increased by over 500% in the last 24 hours. Significant contributions came from two specific addresses that moved large amounts of SHIB to dead wallets, highlighting a notable market movement. The address starting with 0x608… burned 3.10 million SHIB, while the address starting with 0xa9d… burned 4.69 million SHIB, removing them from circulation.
Technical Indicators and Market Sentiment for SHIB
Shiba Inu is currently facing critical resistance at the $0.000025 level. Overcoming this barrier could push the price to $0.000026 and potentially pave the way to $0.00003.

On the other hand, a decline could pull the price back to the support level at $0.000024, and further downward momentum could drive the price down to $0.000023.
Currently, the Relative Strength Index (RSI) for SHIB is at 47.14, indicating a neutral zone for the altcoin. This means SHIB is neither overbought nor oversold. The Moving Average Convergence Divergence (MACD) shows a slightly positive histogram, indicating a potential buying opportunity. Additionally, the Average Directional Index (ADX) value of 13.84 points to a weak market trend, while the Awesome Oscillator (AO) value of -0.00000044 indicates a bearish trend.

 Türkçe
 Español


