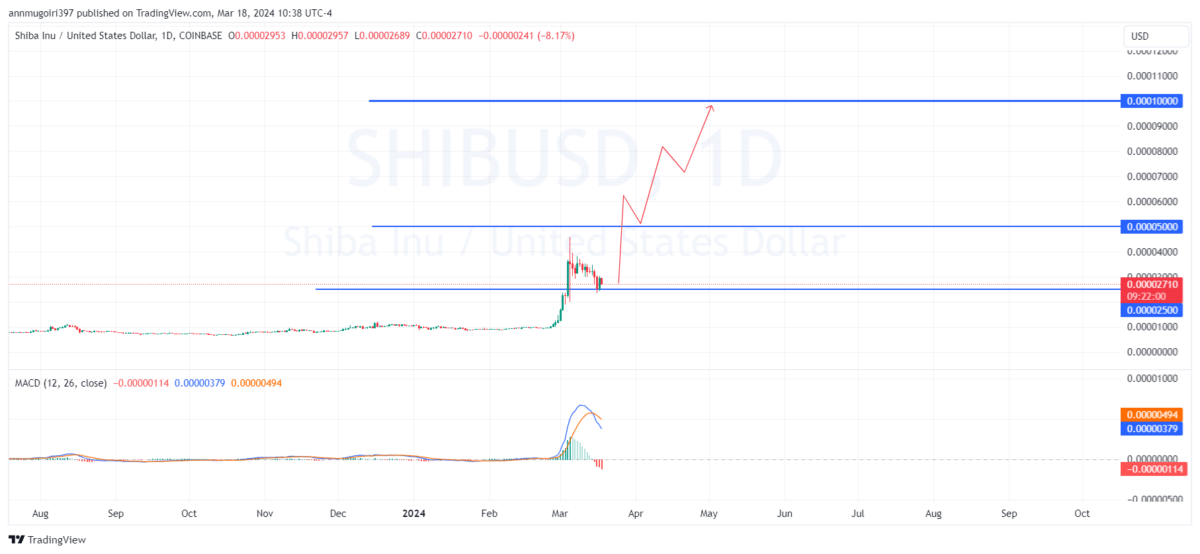
The popular meme token Shiba Inu (SHIB) has displayed an impressive performance in the cryptocurrency market. The value of the cryptocurrency has increased by 6% in the last 24 hours, which could indicate a recovery trend after a 17% drop the previous week. The current Shiba Inu price is $0.00002769, which could signal a positive trend for investors.
SHIB Faces Critical Price Range
In recent transactions, Shiba Inu’s price has shown notable resistance. The cryptocurrency’s 24-hour trading volume has seen a slight decrease of 11% to $2.1 billion. Nevertheless, its market value stands strong at $16.42 billion, making the token the 11th largest cryptocurrency according to the 21milyon.com website. With approximately 589 trillion SHIB in circulation, market dynamics indicate strong investor interest. Last month, SHIB’s value fluctuated between $0.000009 and $0.000044, which could indicate an upward trend with a value increase of over 183%.
The cryptocurrency’s price reached a monthly high of $0.000044 before correcting to $0.000024. However, since then, it has rebounded and maintained a level above $0.000027. Despite a market correction following Bitcoin‘s drop below the $70,000 threshold, Shiba Inu has shown its strength. Along with other meme tokens like Dogecoin, Pepe, and WIF, SHIB has seen gains in the overall sector’s rise.

SHIB’s Burn Rate
According to data from Shibburn, an important factor contributing to SHIB’s positive trajectory is the increased token burning activity. In just the last day, token burns have surged by 2660%, with 186 million SHIB removed from circulation. Reducing the current supply of the cryptocurrency has added optimism to the market and strengthened SHIB’s economic fundamentals. A potential breakout rally in SHIB could push the price to $0.0001 and beyond. Conversely, a potential decline could bring the price back to support levels of $0.00002, with stronger support at $0.00001 and $0.000009.
Daily technical indicators for SHIB show noteworthy fluctuations, as observed in the data from the charts. The Relative Strength Index (RSI) is at 54.53, indicating a neutral position without reflecting overbought or oversold conditions. Additionally, the Moving Average Convergence Divergence (MACD) shows a crossover with the signal line above the MACD line, which is often considered a bullish signal.

 Türkçe
 Español


