Solana (SOL), one of the most prominent cryptocurrencies of recent times, has finally shown the expected rise and officially met the demands of investors who were eagerly waiting for it. Managing to become the 10th largest cryptocurrency by total market value, SOL has achieved a growth of 5% in 7 days, unlike the rest of the market.
SOL/USD Price Chart
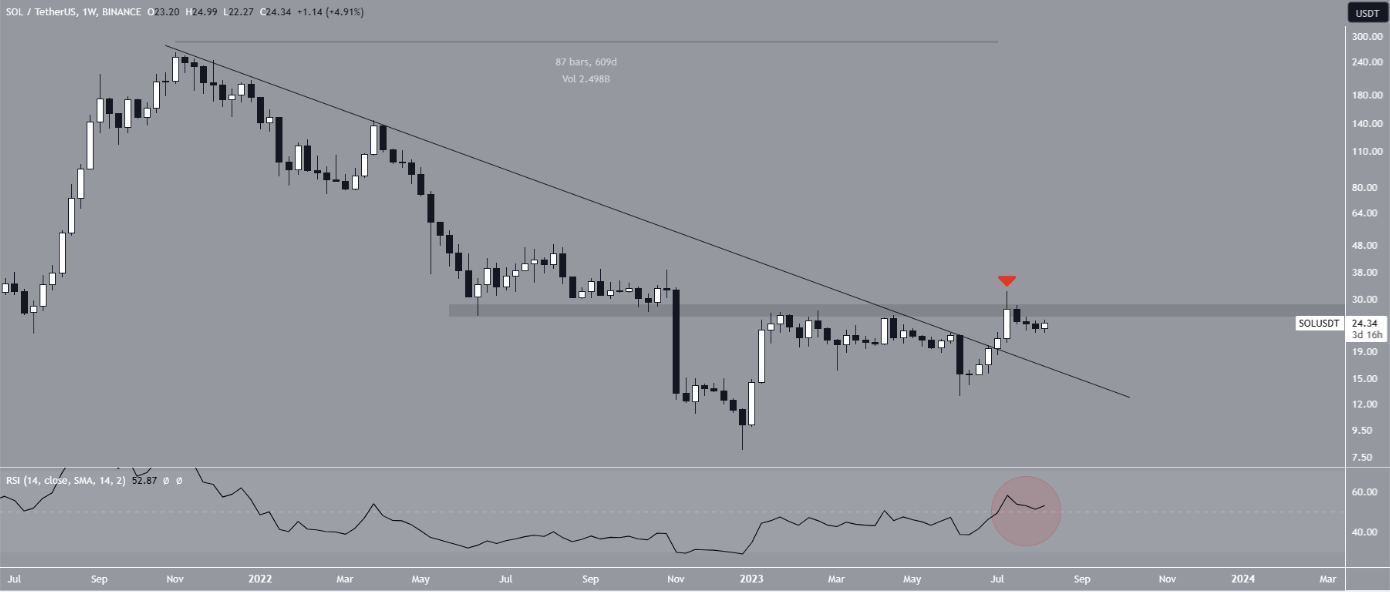
The SOL/USD pair reached $25.20 before starting to decline. SOL retreated to $24 and according to the current chart, it could gain momentum towards $27.
Despite its previous momentum, the SOL price failed to stay above the $27 support. Looking at the current chart, $27 is seen as a critical point of the downtrend since November 2022, and any movement above this level could lead to a horizontal breakthrough. The SOL price is currently supported by the weekly RSI, which is still above the 50 level. RSI can be perceived as another signal of an upcoming uptrend in the coming days.
Trading at $24, SOL will either lose the $23 support and start to decline or make a breakthrough to $27. A close above $27 would guarantee the uptrend and initiate a new bullish trend.

News from the Solana network supports the rise, just like the technical chart. Solana’s Saga Mobile project has reduced web3-focused smartphone prices by 40% and announced its goal of reaching more users. Solana’s Cypher protocol experienced a $1 million loss on Monday, and the situation looks bad.
Selling Scenario for SOL
Solana is trying to recover from the FTX fiasco and aims to completely separate itself from this story. Solana’s separation from this incident will also have a positive effect on the price. Currently, the current chart indicates targets of $27 and then $32. If this continues, a long-term rise to $40 can be seen. If $27 is tested and fails, the price will first pull back to the $20 level.
The key levels to watch in the SOL/USD pair are therefore known as $20 and $27.


