There was a significant increase in interaction on the Solana (SOL) network recently. This could be attributed to the previous price increase, the recent NFT activity, and most importantly, the Jito (JTO) airdrop. Consequently, there was a substantial increase in the DEX volume on Solana’s network.
Solana’s NFT sales saw a rise last week. It was revealed that there had been an increase in network activity in recent days, and this increase revealed that the Solana blockchain was in first place in terms of total transactions in November. However, despite these developments, the token recently experienced a pullback on the price front.
Solana Chart and Commentary
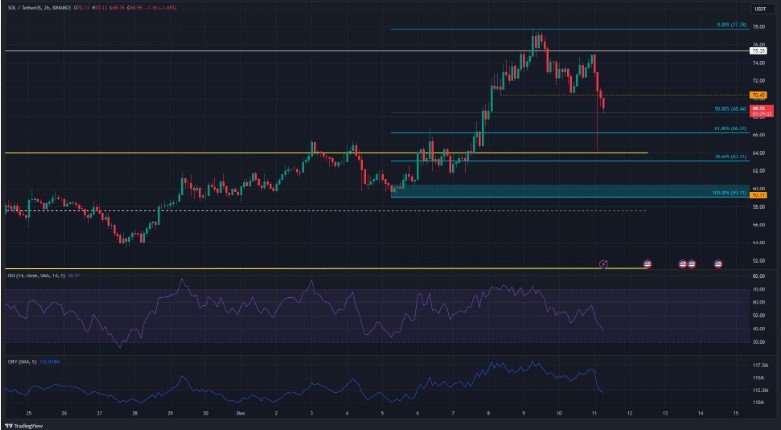
Throughout November, Solana was trading between the yellow levels seen in the chart below. During this period, it climbed from the $51.1 level to $64. On December 7, SOL reached a peak level outside the range and rose to $77.78. It then hosted a decline along with the fall in Bitcoin.

After this process, the RSI fell below the neutral 50 and appeared to have turned in favor of the bears. The On-Balance Volume (OBV) also showed signs of decline over the last three days. Considering this, it could be thought that selling volume was strong. After the price fluctuation on Monday, as seen in the 2-hour chart, the price fell to $64.18 and then received a swift response.
Still, according to the analysis, it wouldn’t be wrong to say that the downtrend continues in the two-hour time frame. In recent days, falling below the lowest level seen as support after this level was passed brought along bearish comments.
Fibonacci retracement levels (turquoise) were drawn taking into account the biggest rallies, and levels between $63.11 and $66.24 stand out as points where the uptrend could be triggered.
Solana Coin’s Future
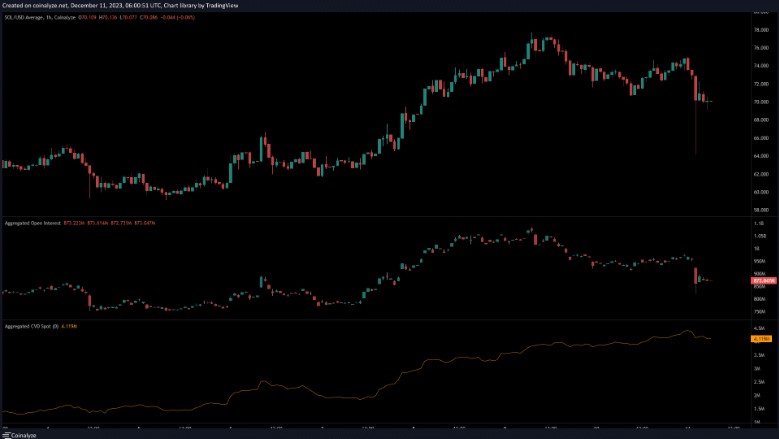
Following the transactions of the last two days, Solana’s price slowly pulled back from $78 and then fell to $70. This decline was also accompanied by a decrease in Open Interest (OI). The reflection of the decrease in OI and prices in the market can be interpreted as investors losing their bullish trends.
However, the spot CVD showed an upward momentum. This could offer some relief to investors because even if the short-term sentiment is bearish, the appearance of CVD in spot markets could indicate healthy demand for the token. Investors may therefore consider the recent pullback to be temporary and lacking depth.
In a broader time frame analysis, it would not be wrong to say that the region between $60 and $65 was calculated as the first support level where recovery could potentially resume for the bulls.


