
Solana‘s (SOL) daily timeframe price chart reveals a clear double bottom formation for the altcoin. This formation typically occurs when the price reaches a bottom and indicates a strong potential for an upward movement. A double bottom formation consists of two consecutive troughs supported by a common price level. Currently, the common price level for SOL’s double bottom formation is $22.4. The completion of this formation suggests a positive outlook for Solana.
Solana Price Analysis
On August 7th, SOL experienced a significant jump from the $22.4 level. This jump resulted in a 9% increase, bringing the altcoin’s price to the current level of $24.45. This rapid turnaround is closely related to the bullish sentiment generated by the formation of the double bottom.
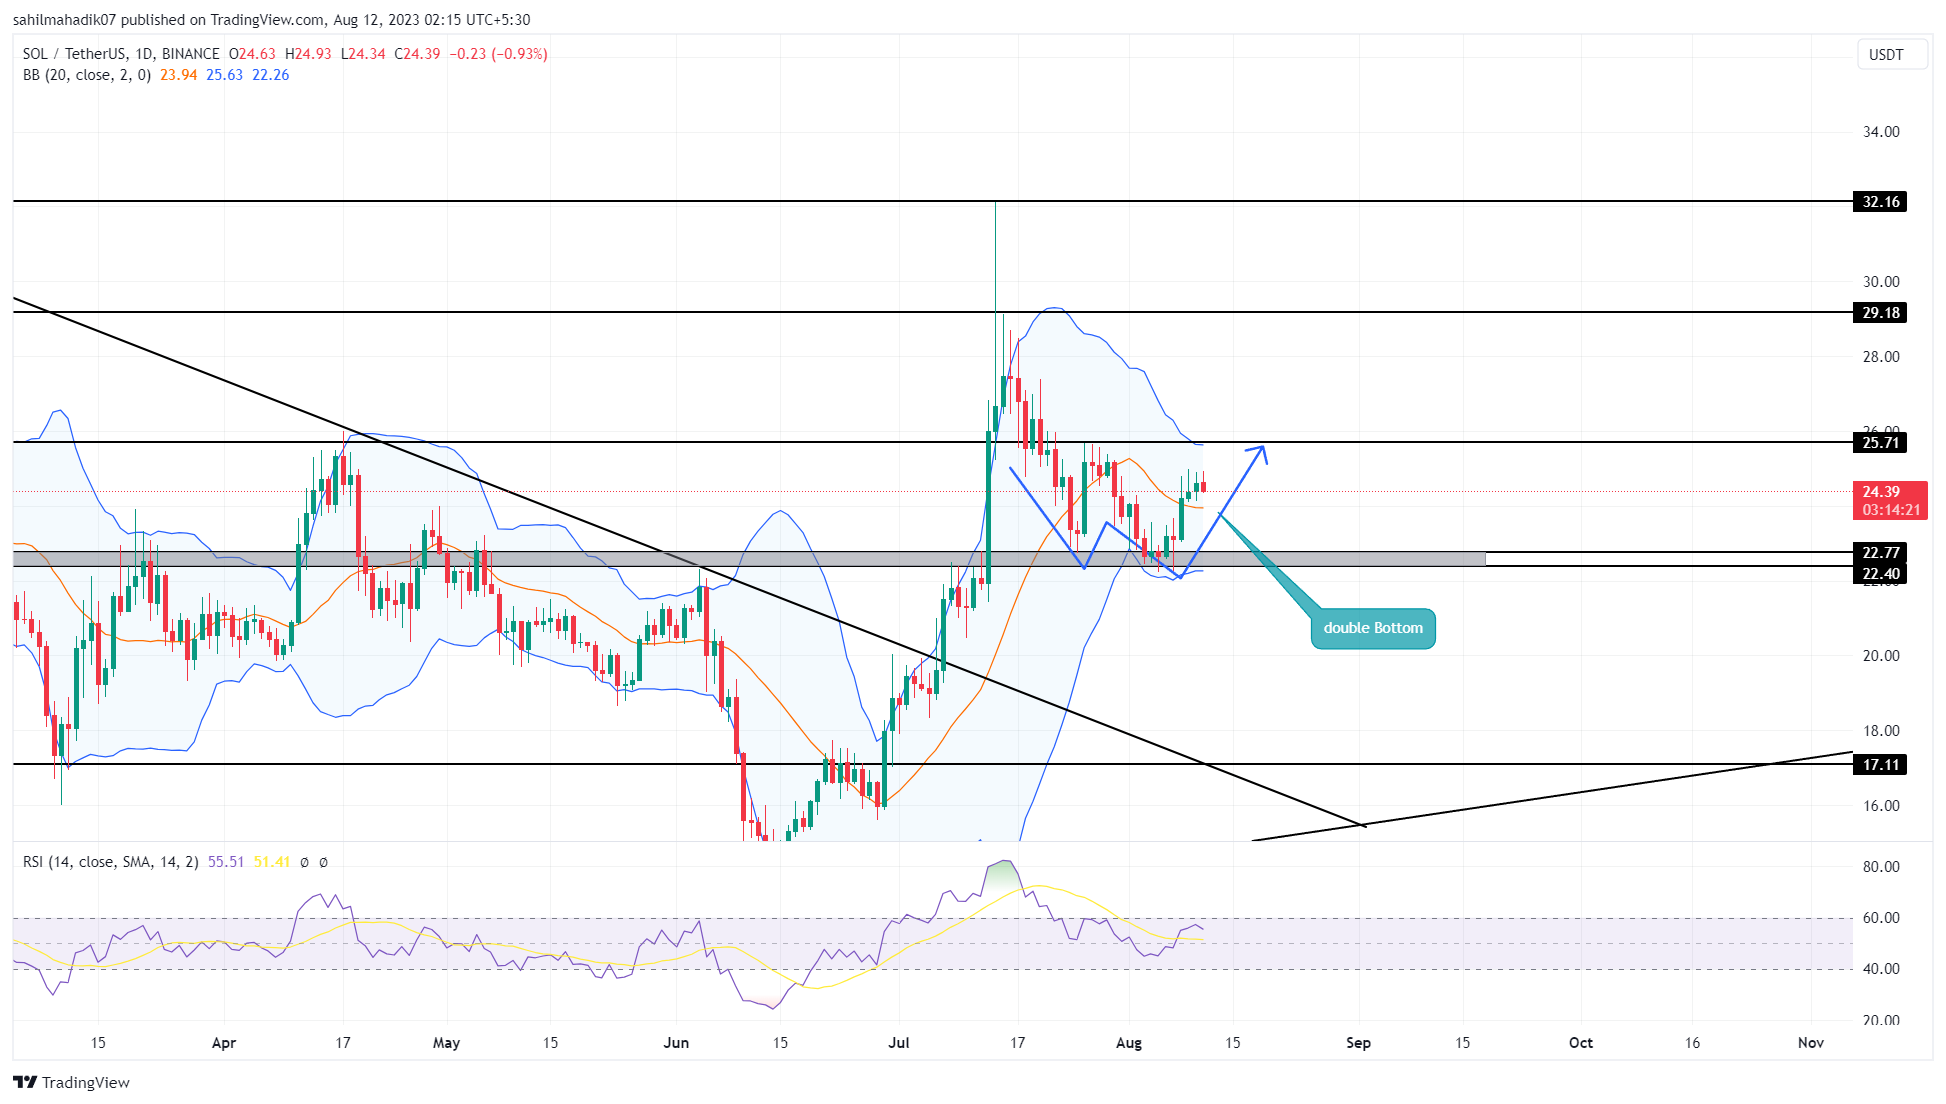
The current price chart indicates a potential 5.8% price increase for SOL, with the initial target resistance level at $25.7. If this resistance level is surpassed, it may trigger a stronger buying momentum and push the price towards the range of $29 to $30, and eventually $32.
According to CoinMarketCap data, SOL traded at $24.52, showing a 0.16% increase in the last 24 hours.
The Most Bearish Scenario for SOL Price
On the other hand, the daily timeframe price chart indicates that Solana’s price is forming higher wicks and short-bodied candles, suggesting a weakening bullish momentum. Approaching the resistance at $25.7 and encountering selling pressure could result in a price drop and consolidation within a narrow range for a few trading sessions. During this consolidation, the momentum is likely to strengthen, leading to a directional movement.
The Bollinger Bands indicator on Solana’s daily timeframe price chart currently highlights a sideways market or lack of direction. The upward potential of the Relative Strength Index (RSI) indicator’s slope above 50 indicates a favorable scenario for an uptrend.