Türkçe
 Español


Technical analysis is a crucial indicator that investors, especially those trading in the futures market, need to constantly follow in the cryptocurrency market. So, what clues does technical analysis provide for Solana trading at $62.66 and Chiliz trading at $0.07750 at the time of writing? Let’s delve into a detailed chart analysis, important support and resistance levels.
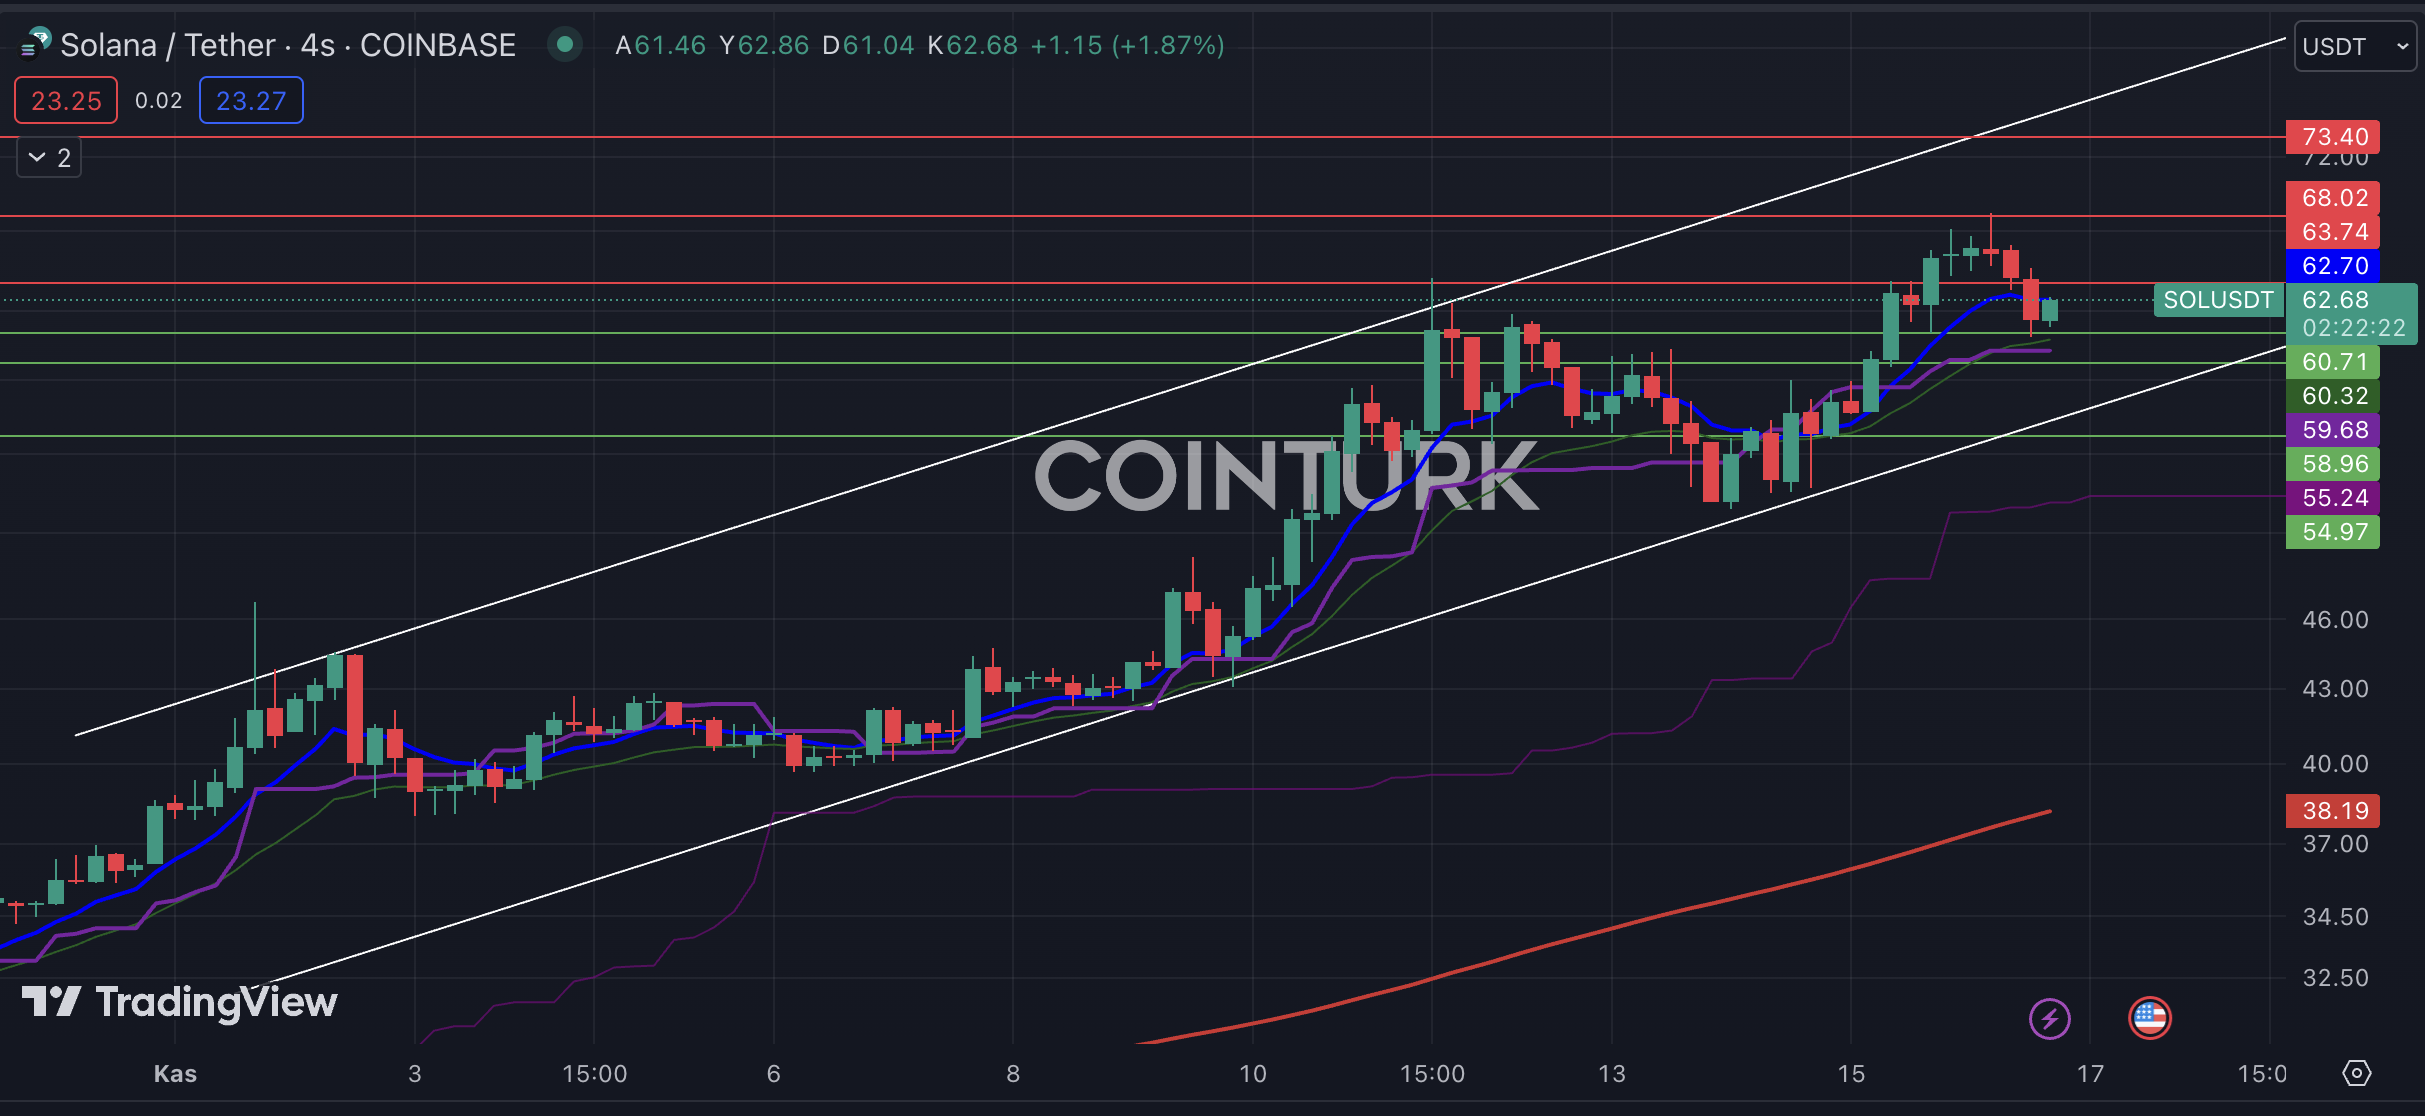
Solana Chart Analysis
Solana stands out with its ascending channel formation in the four-hour chart analysis. After consolidating in the support zone on November 14th, Solana experienced a notable rise in the following period. However, today’s decline led to a correction in the Solana market as well. The fact that the price remains below the EMA 7 (blue line) level is currently seen as a negative factor for SOL.
The notable support levels for SOL are $60.71, $58.96, and $54.97, respectively. Particularly, a four-hour candle closing below the $54.97 level could invalidate the ascending channel formation and lead to a significant correction in the SOL price. In such a scenario, the EMA 200 (red line) level at $38.19 may come into play in the short term.
The resistance levels to watch for SOL are $63.74, $68.02, and $73.40, respectively. Especially, a candle closing above the crucial $68.02 level, which emerged as a significant obstacle in the recent uptrend, could pave the way for a different phase for SOL.
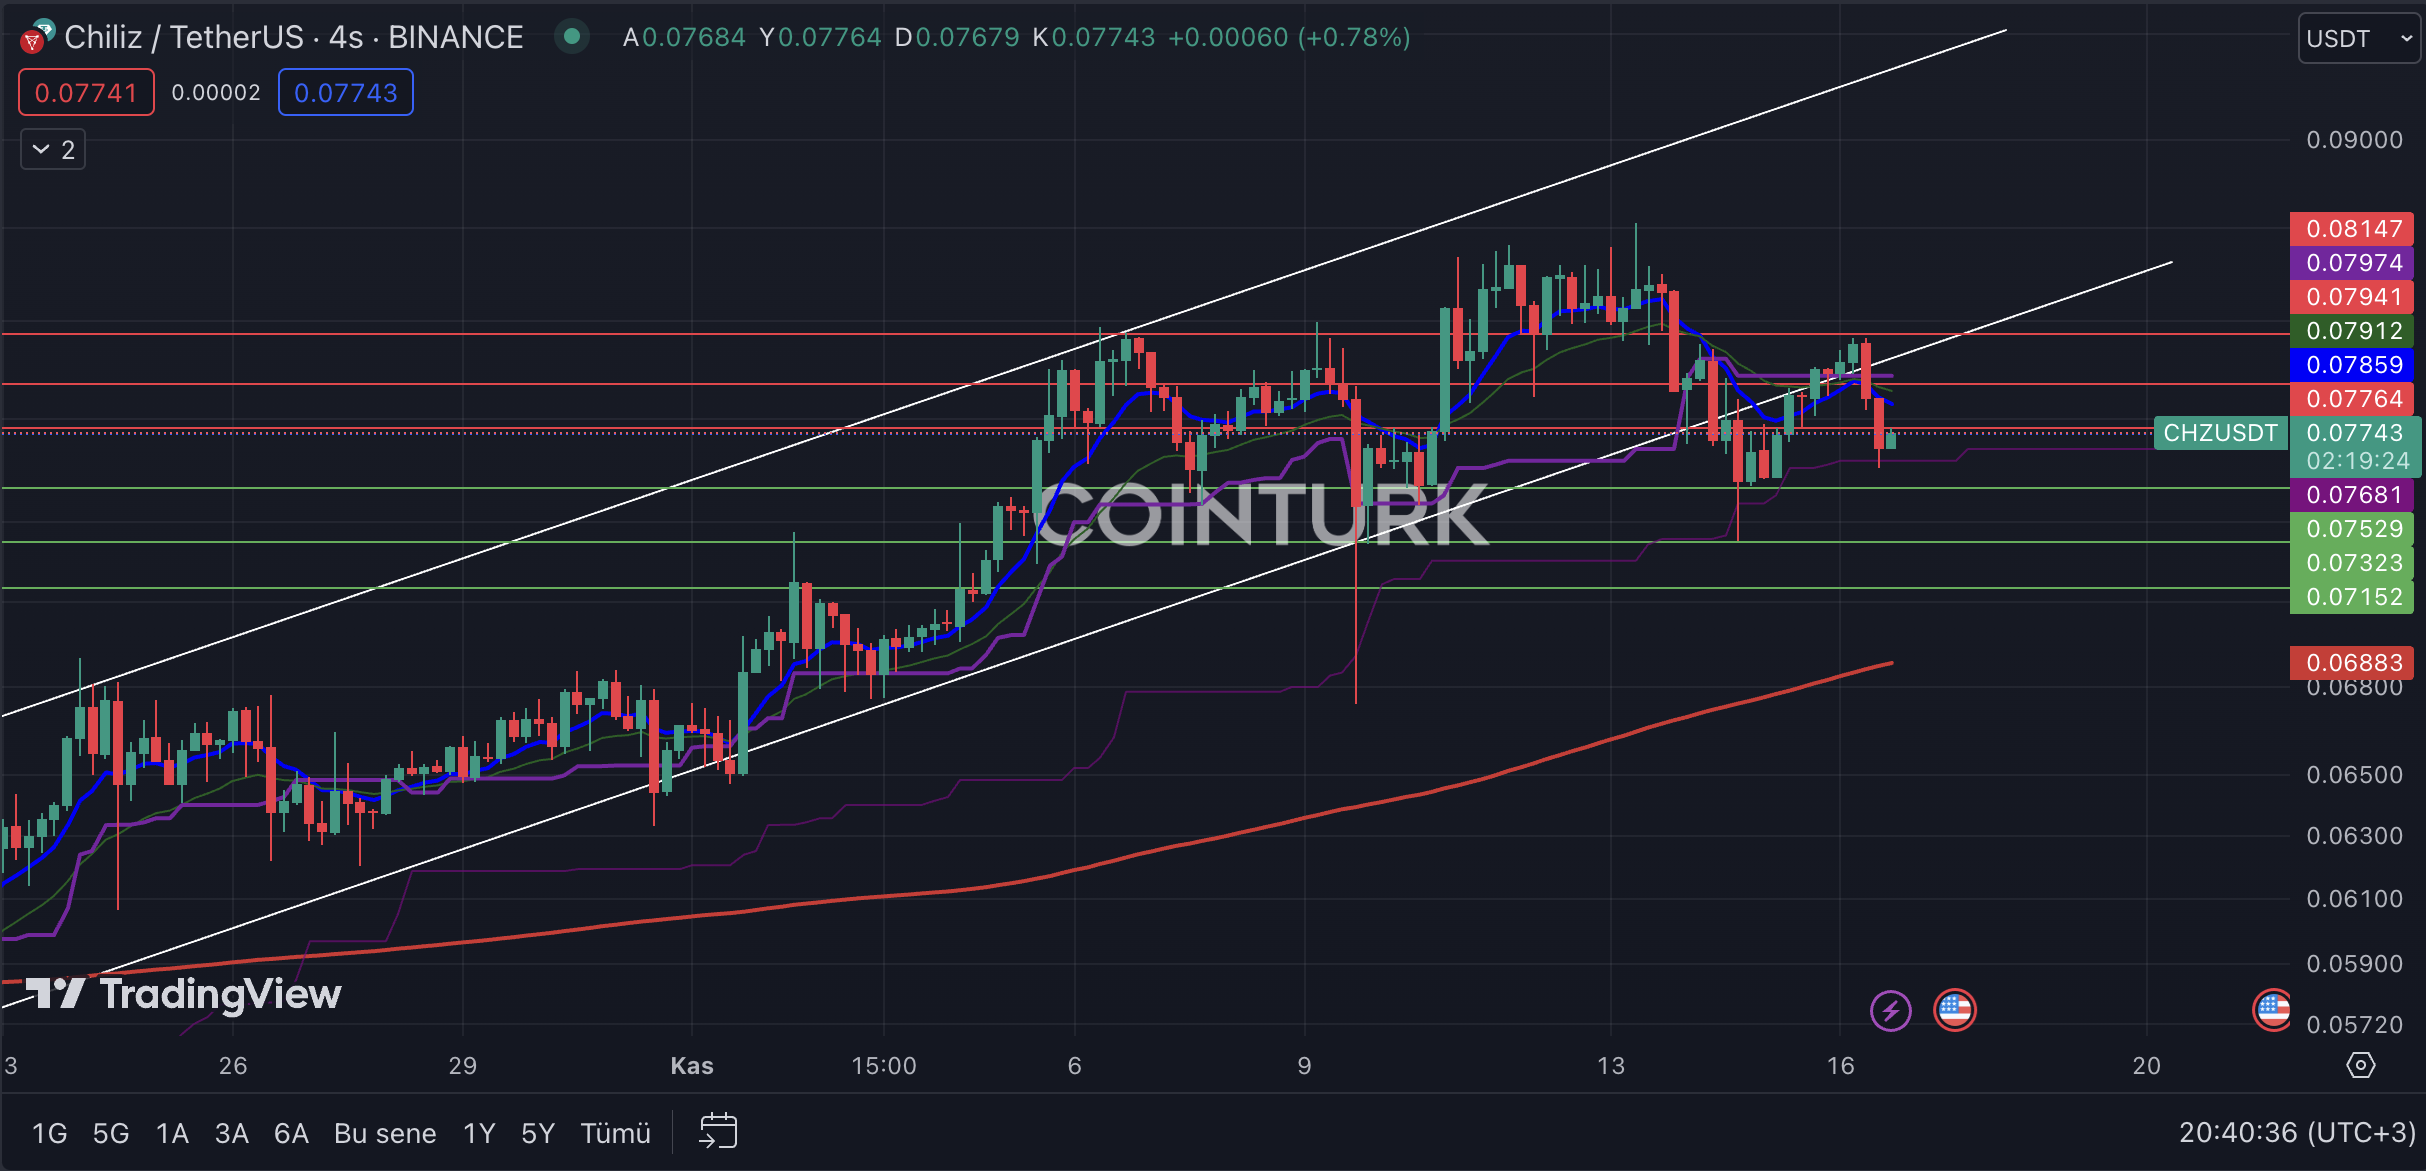
Chiliz Chart Analysis
Chiliz displays an ascending channel formation in the four-hour chart analysis. However, with the recent downward pressure, a breakdown of the ascending channel formation occurred. During this process, the price initially set a bear trap and then experienced a significant value loss, resulting in substantial fund losses for futures traders in particular.
The support levels to pay attention to for Chiliz in the four-hour chart are $0.07529, $0.07323, and $0.07152, respectively. Especially, a candle closing below the $0.07323 level, which has recently served as significant support, would increase the selling pressure on Chiliz.
The resistance levels to monitor for Chiliz in the four-hour chart are $0.07764, $0.07941, and $0.08147, respectively. Especially, a candle closing above the $0.08147 level would indicate entering a new formation.