Different events are being discussed in the cryptocurrency markets every day. Today, after a speculative event, Bitcoin is trading at $28,486 at the time of writing. This situation indicates that the daily bar closing could occur above the $28,000 resistance. So, how are things in the altcoin market? In this content, we will examine the graphs of Solana, Ceek, and Chiliz.
Solana Graph Analysis
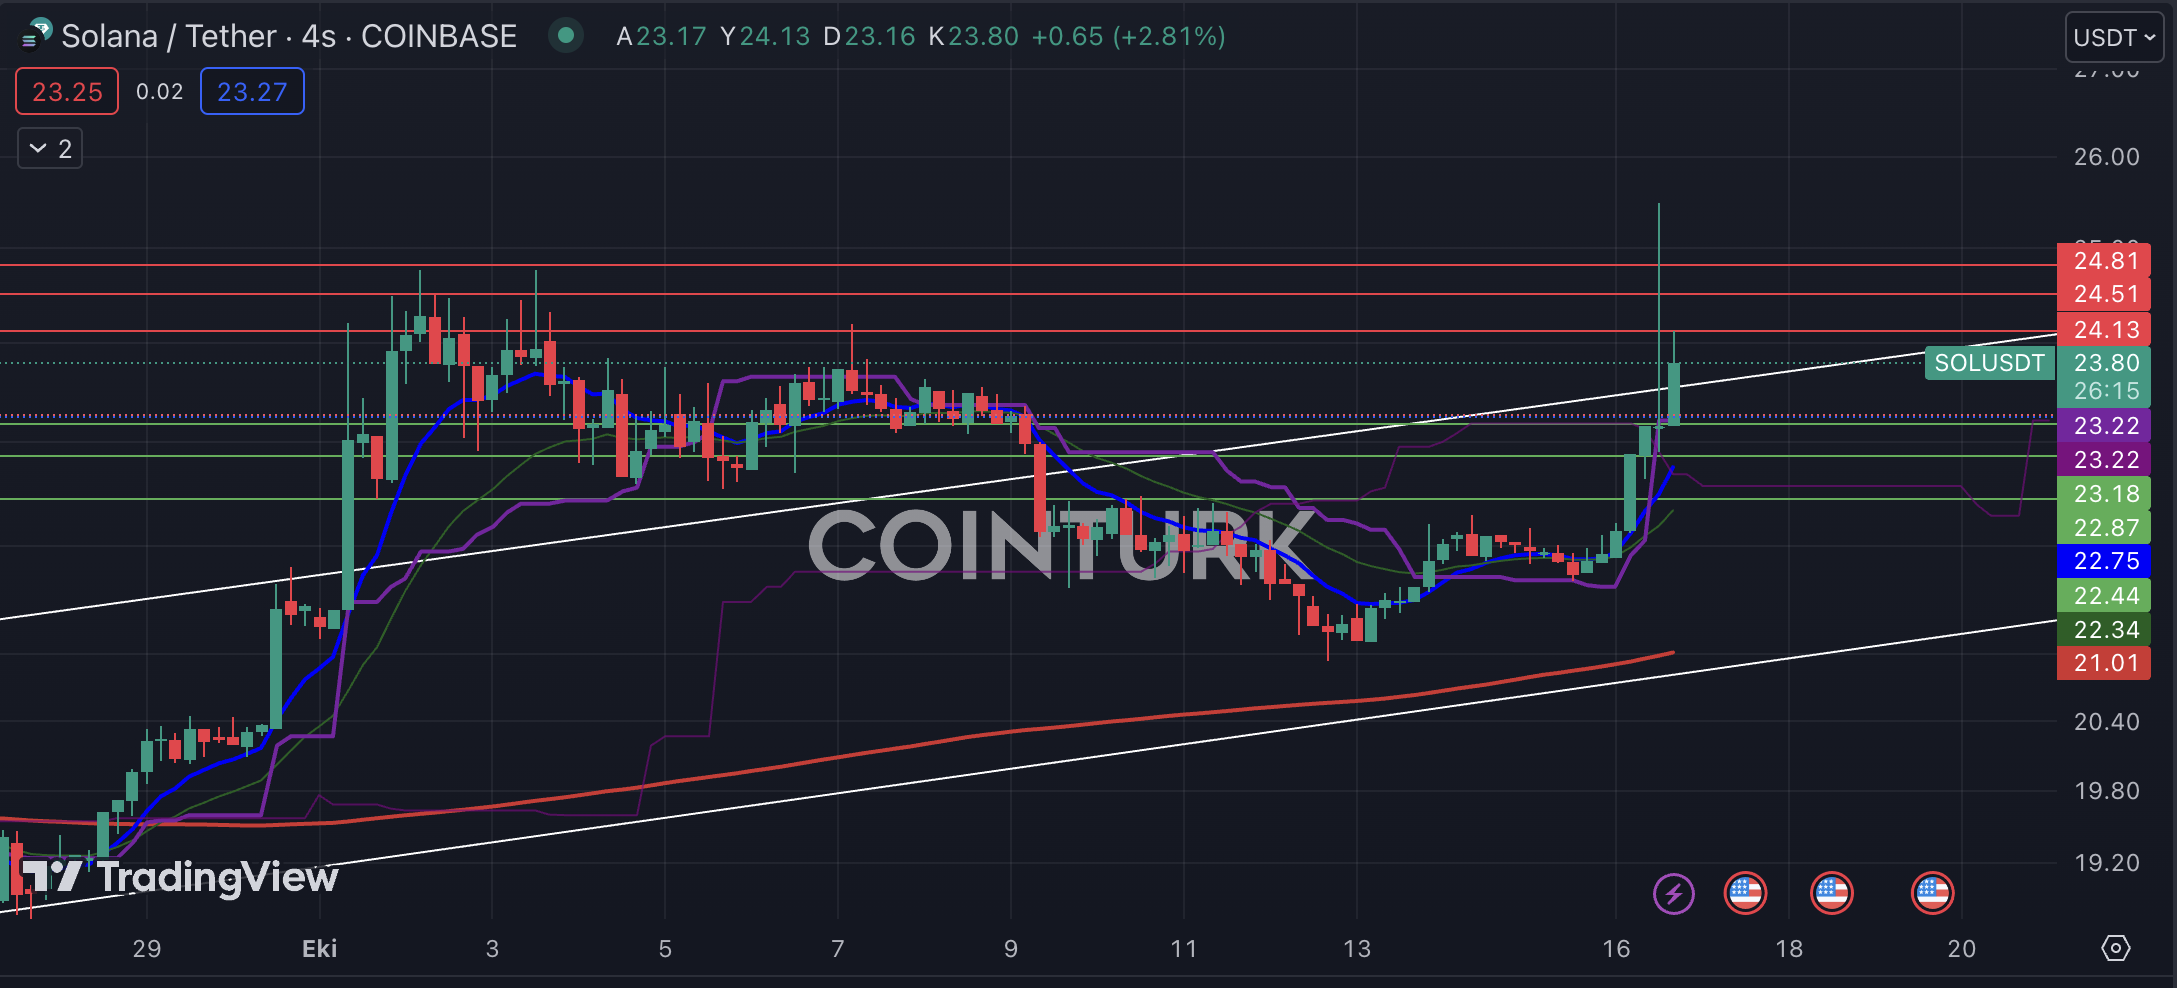
The developments in the FTX lawsuit directly affect the Solana side. Last month, there was a significant drop in SOL price due to a court decision, but this situation was fixed after a short-lived panic. Now, the ascending channel formation on the four-hour chart is very close to breaking the resistance for the second time.
The support levels that need to be followed for SOL are respectively; $23.18, $22.87, and $22.44. Especially, a closing below the $22.44 level could cause the price to drop to the EMA 200 level, which is $21.01. The resistance levels that need to be considered for SOL are respectively; $24.13, $24.51, and $24.81.

Chiliz Graph Analysis
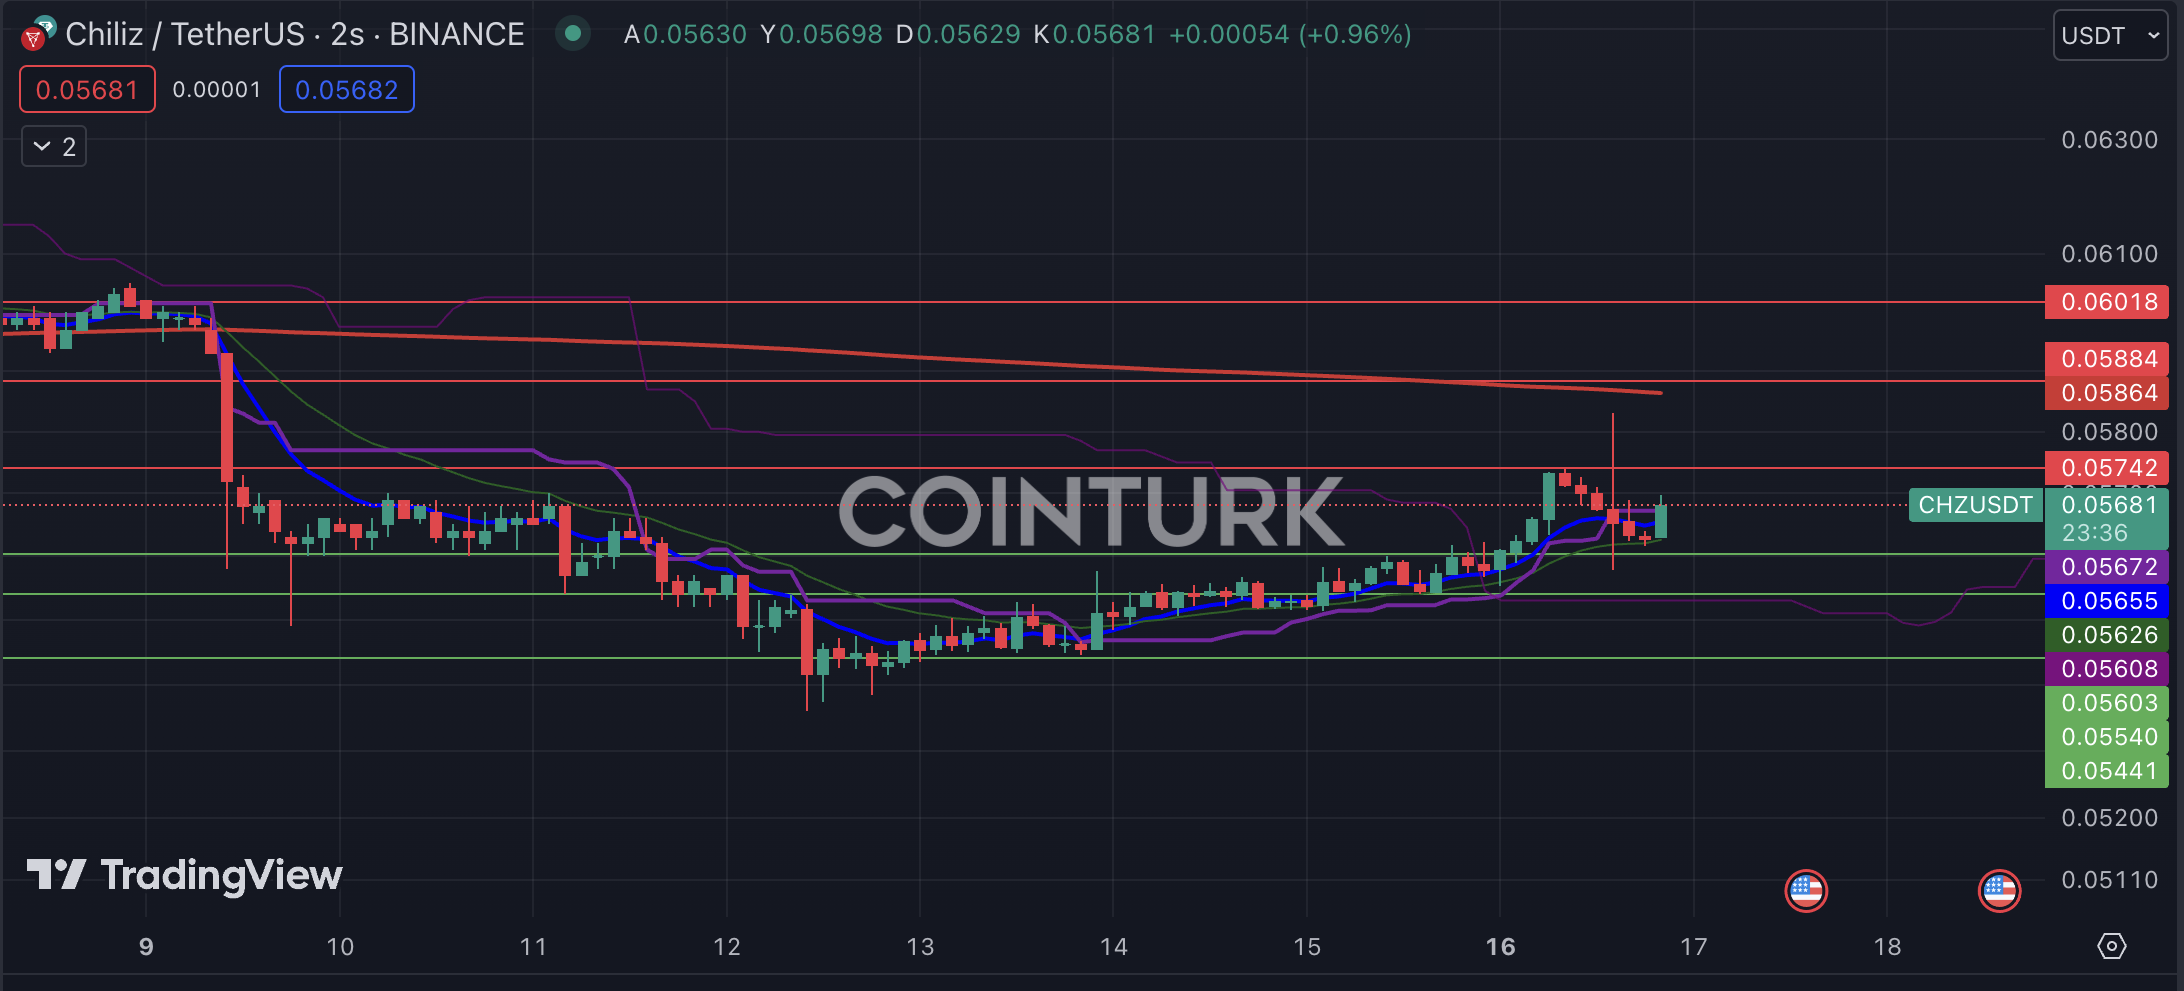
The two-hour chart of Chiliz, which Turkish investors closely follow, shows that the price of Chiliz has been rising since October 13th. Unlike many altcoins, Chiliz accompanies the rise with smaller steps, and investors are eagerly awaiting a possible collaboration agreement. The lack of a healthy formation formation in the graph reduces the interest.
The support levels that need to be followed for Chiliz are respectively; $0.05603, $0.05540, and $0.05441. Especially, if a bar closing below the $0.05441 level occurs, it could lead to a significant drop. The resistance levels that need to be considered for Chiliz are respectively; $0.05742, $0.05884, and $0.06018.

Ceek Graph Analysis
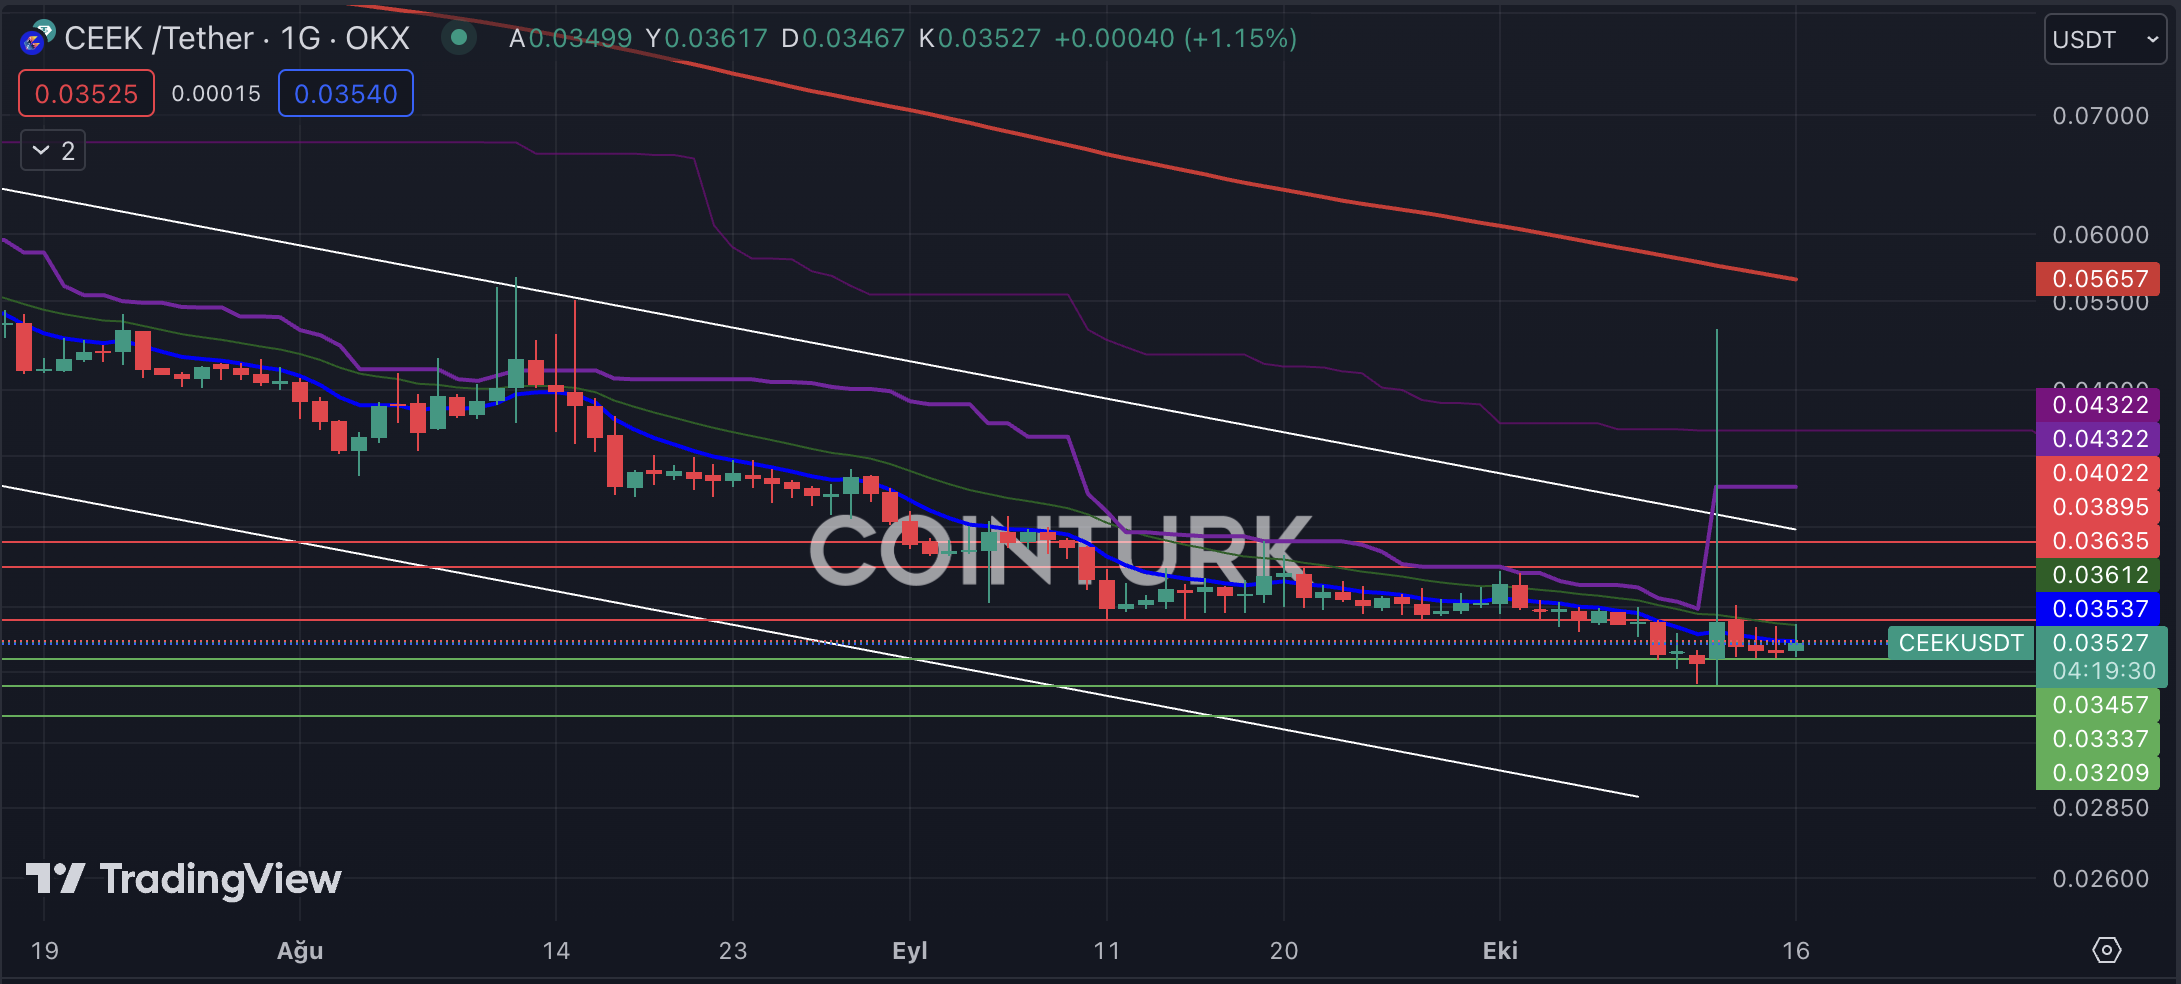
Since the launch day, Ceek has experienced a significant drop. Recently, a resistance breakout occurred in the descending channel formation, but the daily bar closing did not exceed the resistance. Ceek, which is stuck in a narrow range and losing investor interest, needs a notable development. The inability to accompany today’s rise also proves the lack of investor interest.
The important support levels that need to be followed for Ceek are respectively; $0.03457, $0.03337, and $0.03209. Especially, if a daily bar closing below the $0.03337 level occurs, it could accelerate the price drop. The important resistance levels that need to be considered for Ceek are respectively; $0.03635, $0.03895, and $0.4022.


 Türkçe
 Español


