Ripple‘s native token XRP moved within a narrow price range, maintaining a relatively stable trading pattern over the past month. Despite falling below its horizontal channel during the market decline on August 5, XRP managed to recover and continue its horizontal movement. Despite limited price volatility, most daily transactions related to XRP do not show resilience in trading behavior.
What’s Happening on the XRP Front?
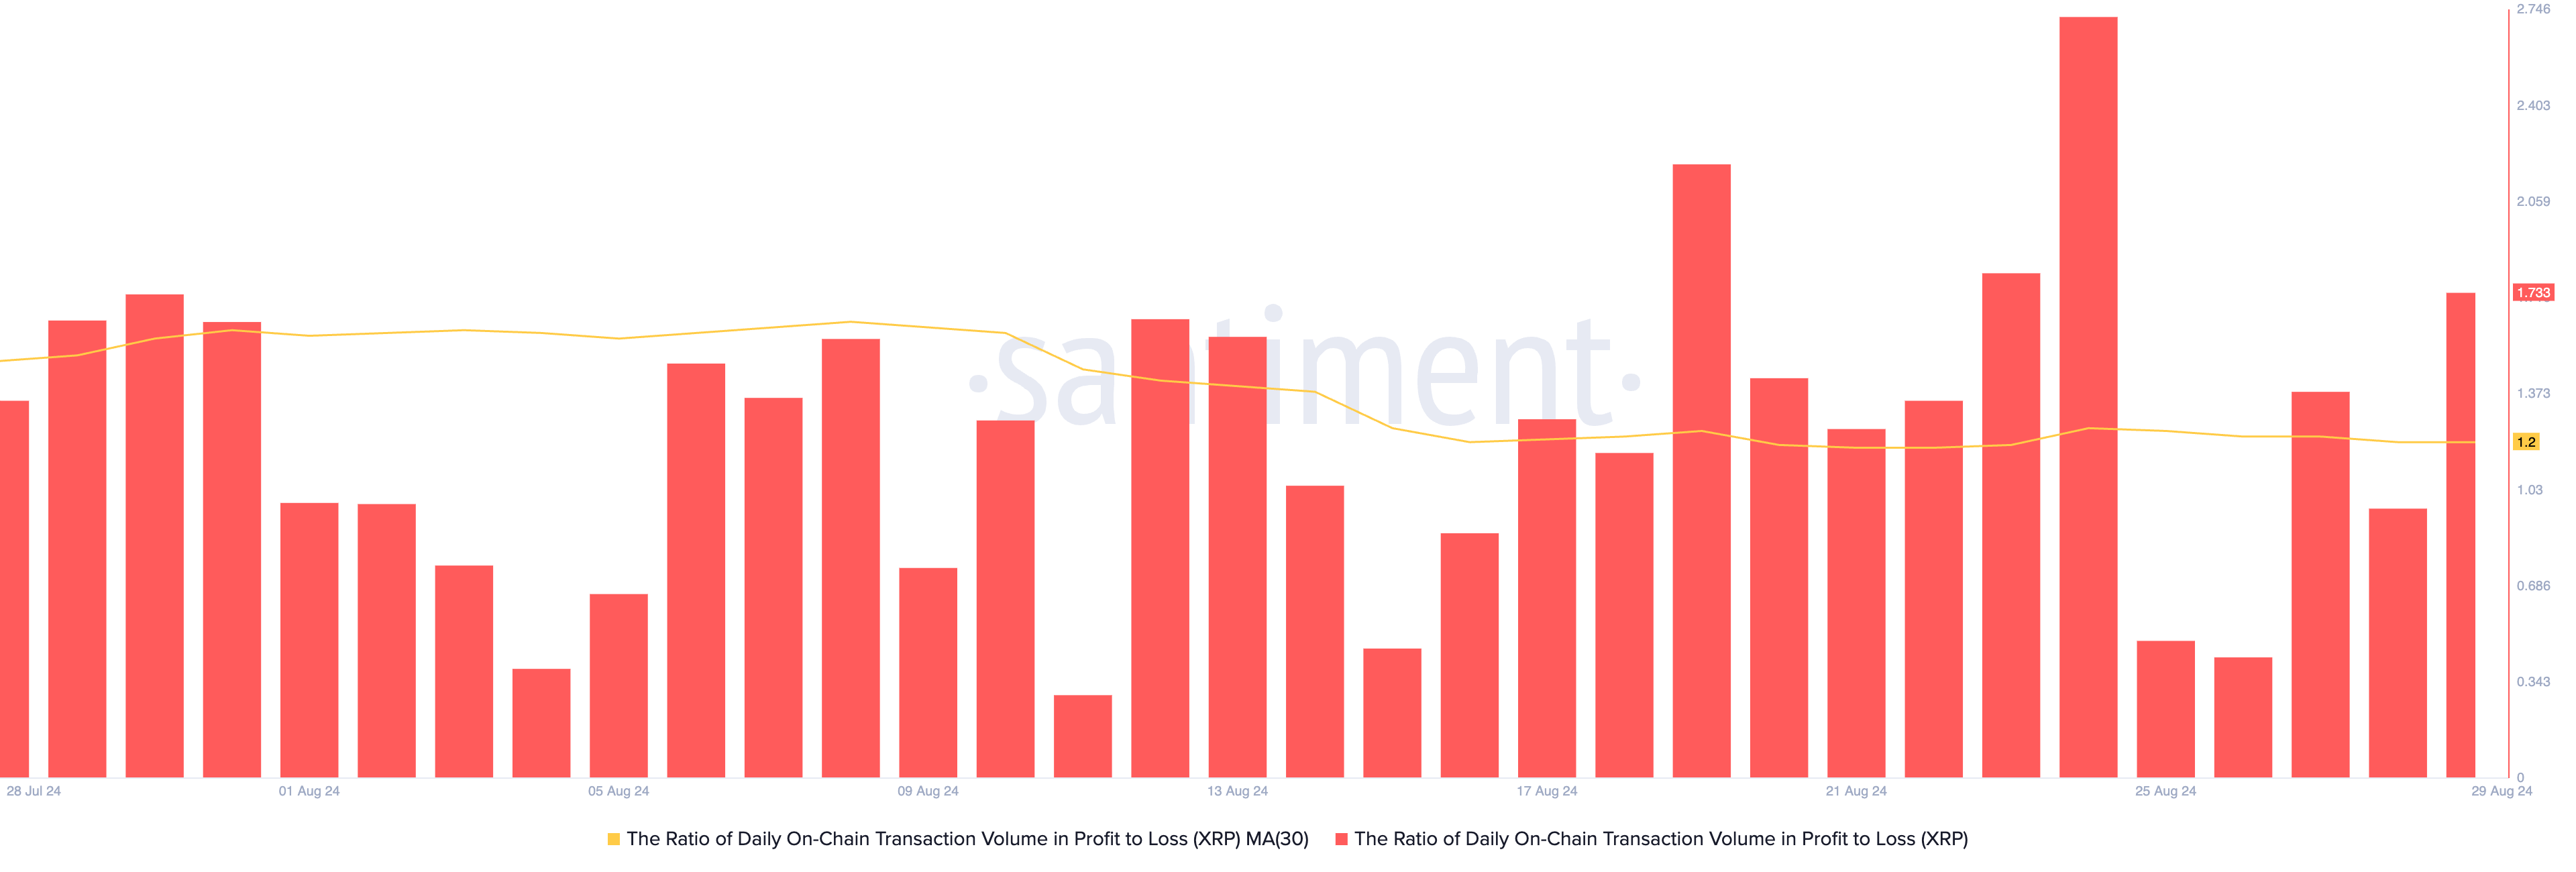
XRP‘s daily profit/loss ratio, evaluated using the 30-day moving average of trading volume, shows that more transactions have been profitable than loss-making over the past month. As of the date of this writing, this ratio is 1.2, indicating that for every loss-making XRP transaction, there are 1.2 profitable transactions.

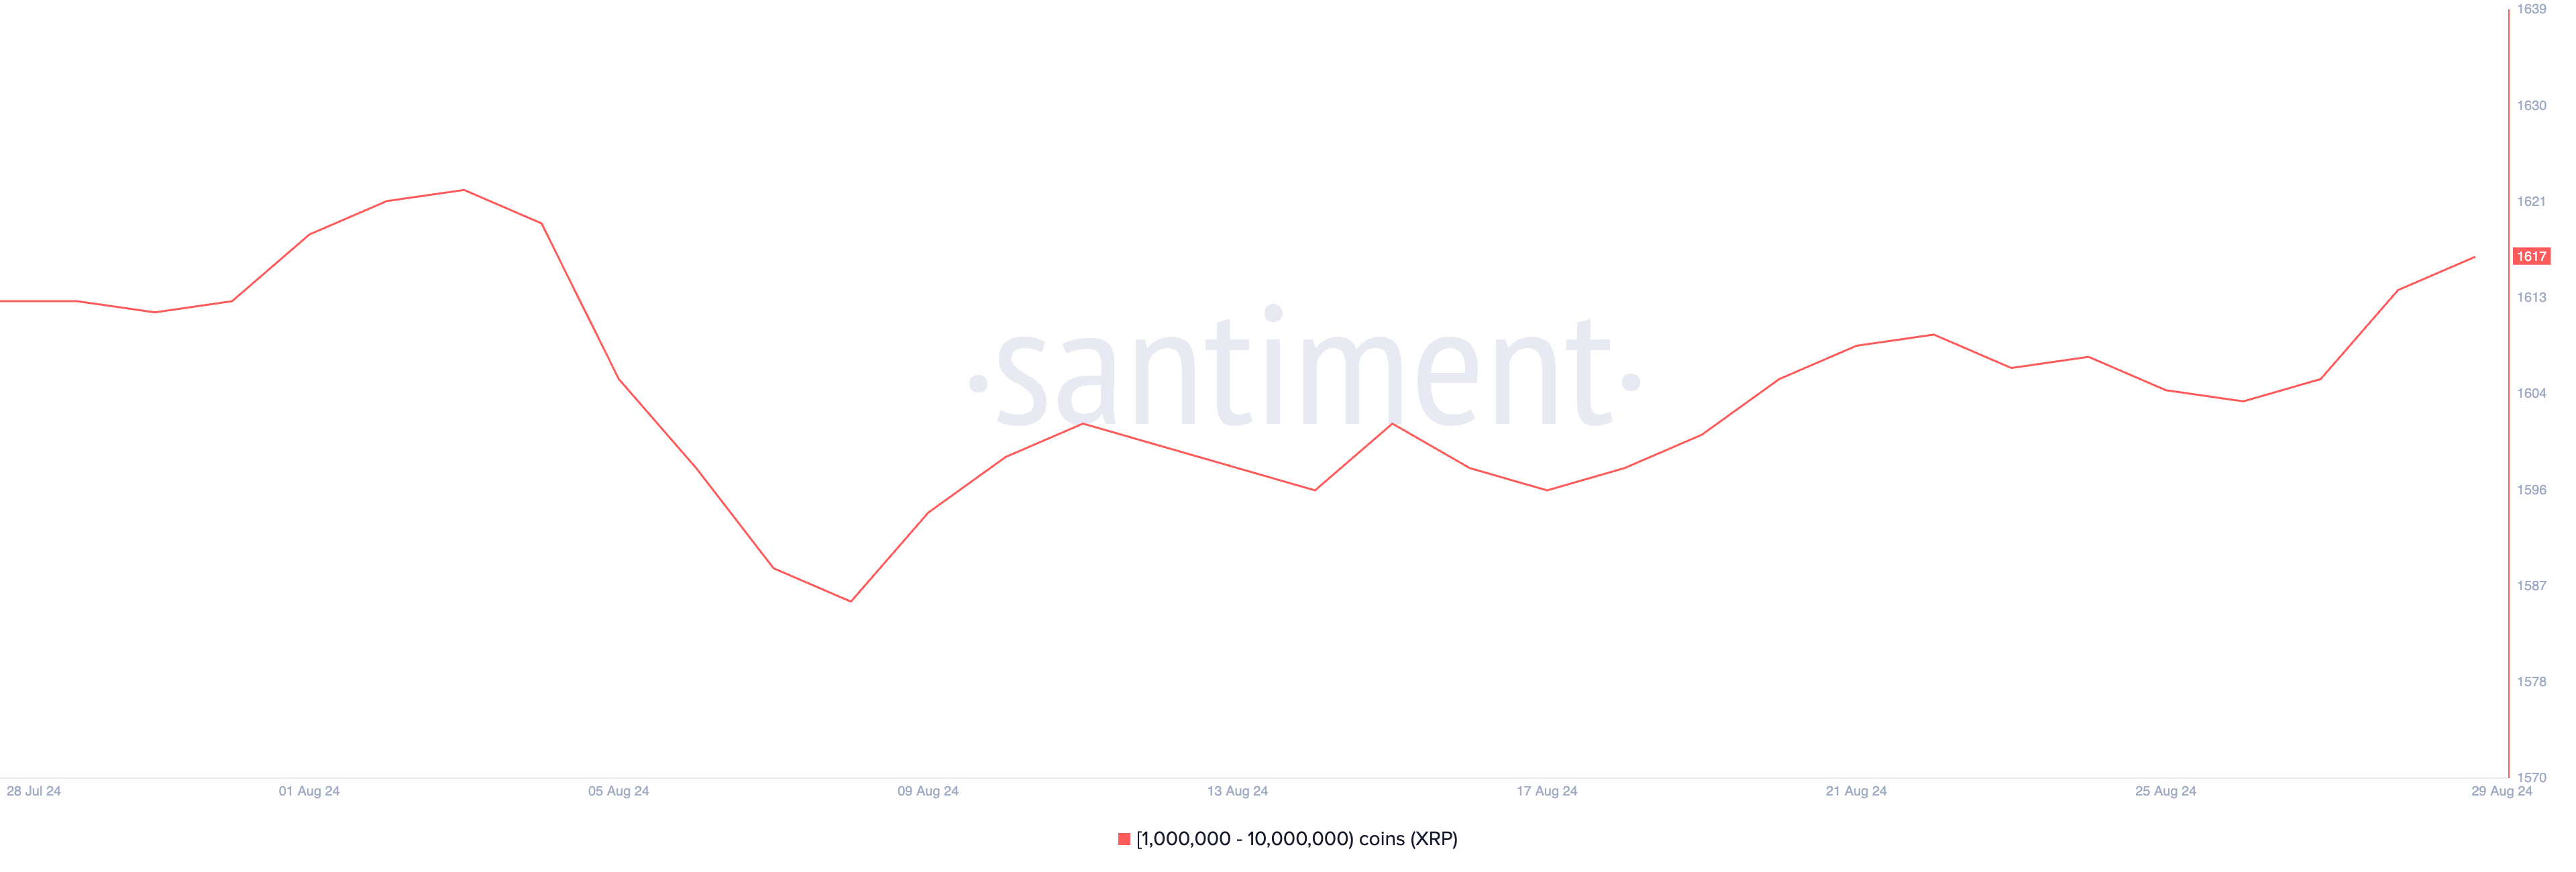
During the review period, XRP whales increased their trading activities. Santiment data shows an increase in the number of whale addresses holding between 1,000,000 and 10,000,000 XRP. At the time of writing, this group consists of 1,617 addresses, and the number has increased by 2% since August 9.

An increase in the number of whales holding an asset is a bullish signal. It indicates strong demand for the asset and can boost individual investors‘ confidence, leading to more buying activity, which can drive up the asset’s price.
XRP Chart Analysis
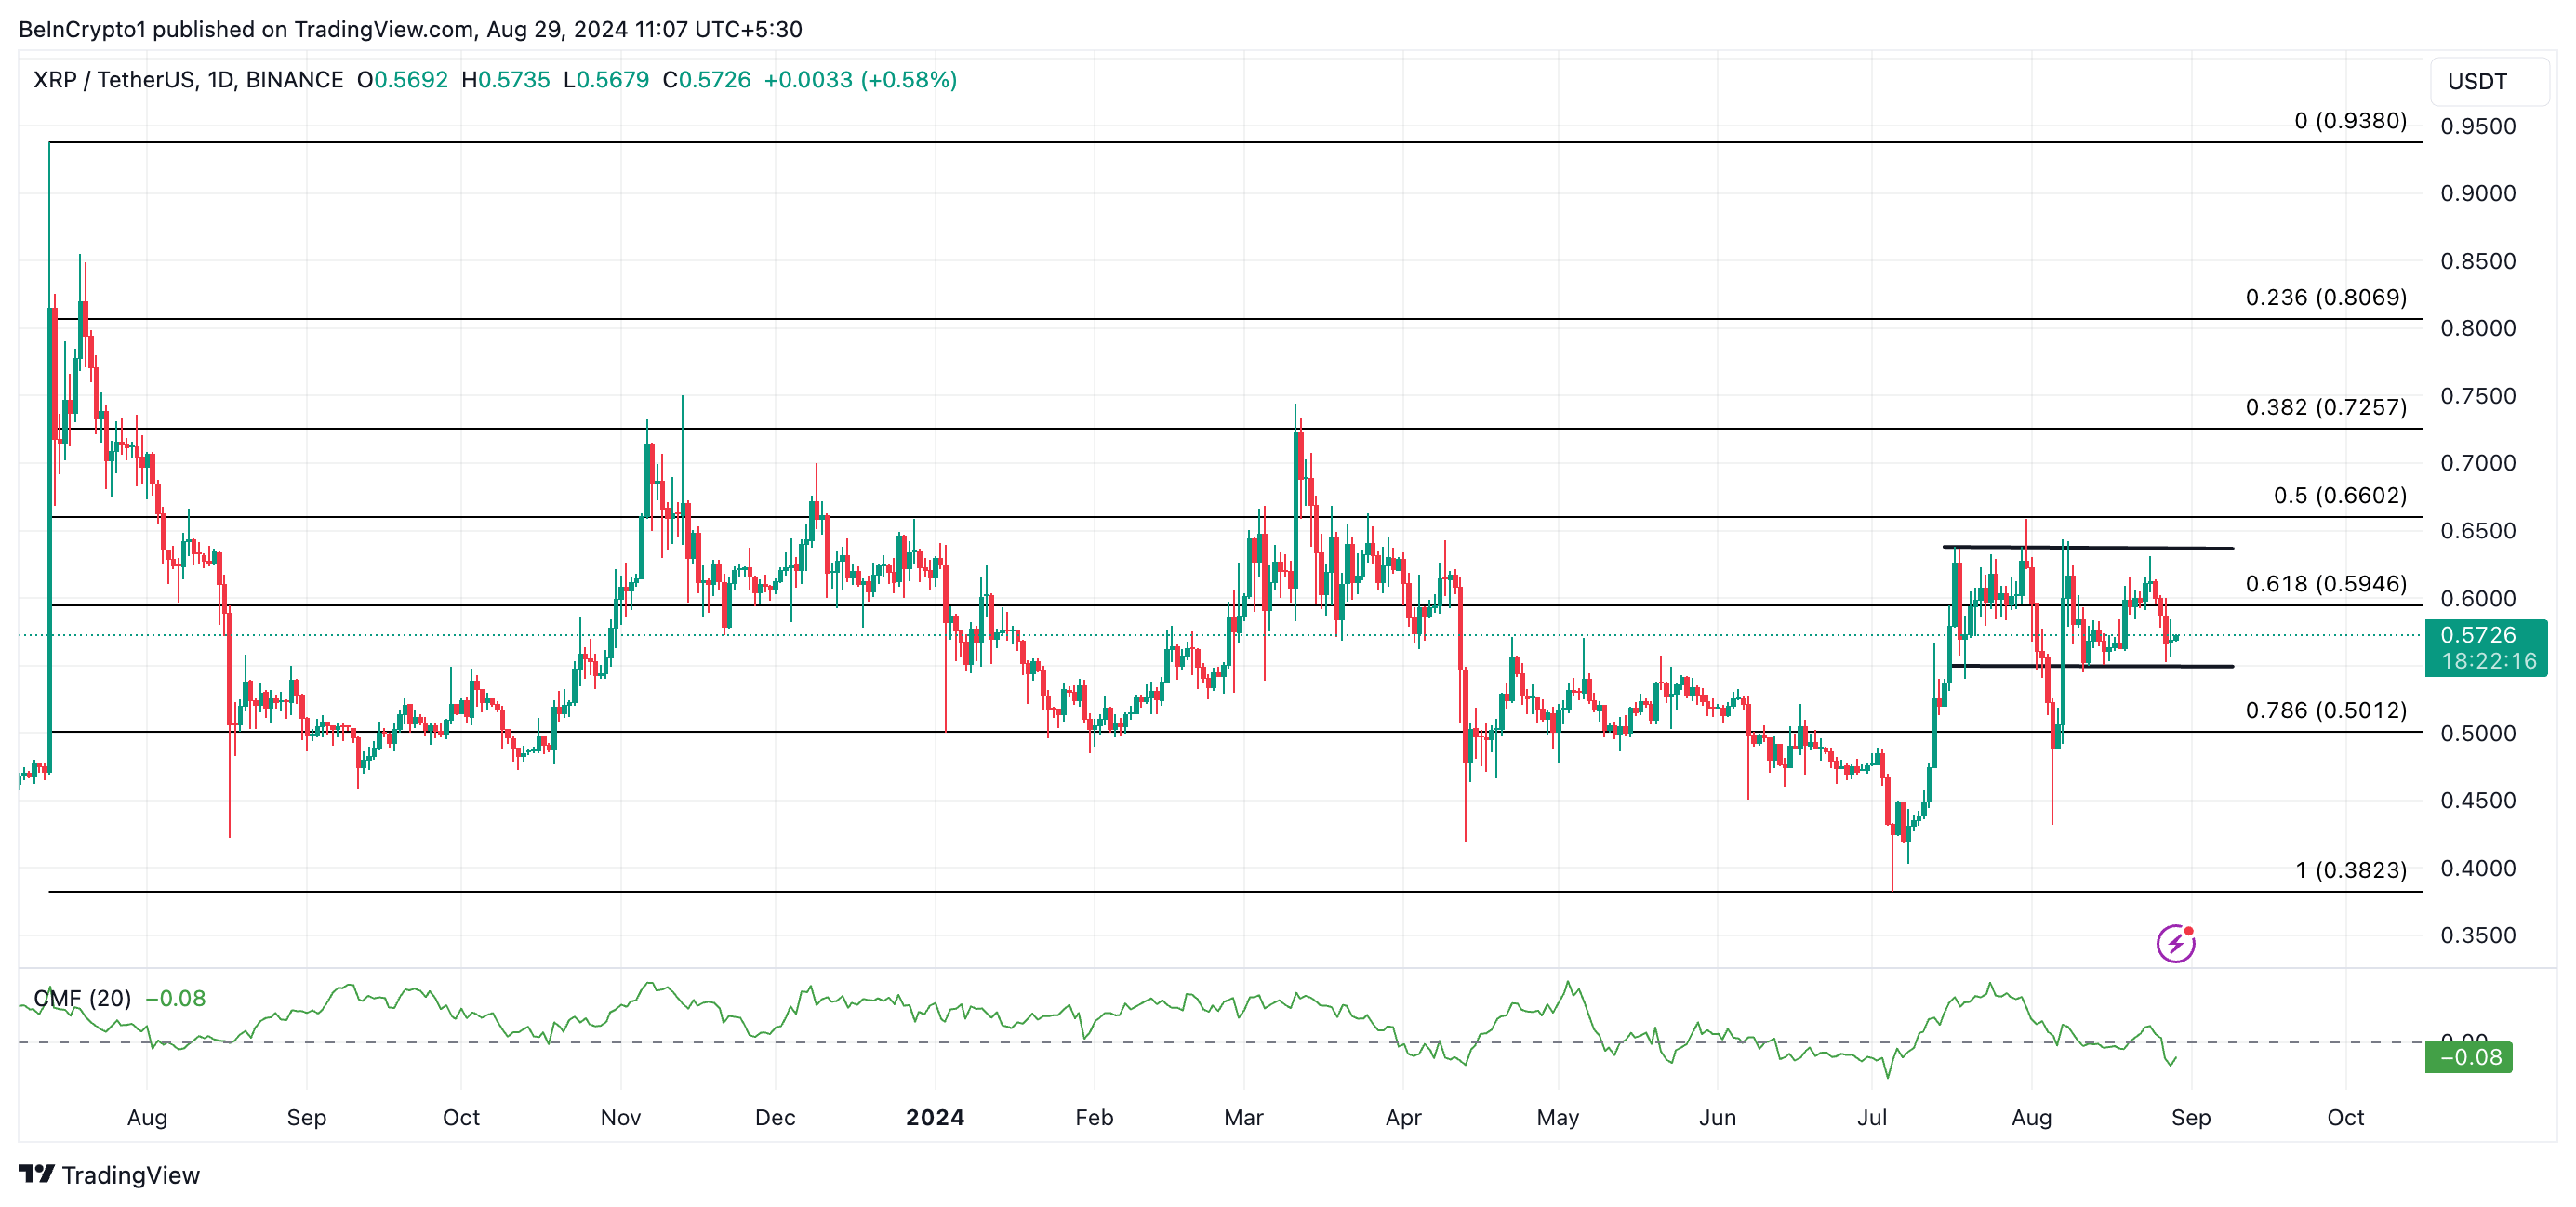
Currently, XRP is trading at $0.57 and has been moving within a horizontal channel since July 17. While the asset’s price trades within a certain range, it forms a channel reflecting a balance between buying and selling pressures, preventing strong movement in either direction. In this case, the upper boundary of the channel acts as resistance, while the lower boundary acts as support. XRP faced resistance at the $0.63 level and found support at the $0.54 level.
Currently, the downward trend is evident as selling pressure outweighs buying activity. This is reflected in the decrease of the Chaikin Money Flow (CMF), which is bearish for XRP and currently stands at -0.08. The CMF indicator measures the money flow into and out of an asset. A negative value indicates market weakness and high selling pressure.

If this trend continues, XRP’s price may move towards the support line of its horizontal channel. If the bulls cannot defend this level, the bearish trend could push the token’s price down to $0.50. On the other hand, if the bulls regain control, XRP could rise towards the resistance level and attempt to break through it. If successful in surpassing the resistance, XRP could trade at $0.66.


