
The digital currency XRP experienced a notable decline of 4.3% between August 28 and 29, dropping from $3.02 to $2.89 within a 24-hour span. Despite the bearish sentiment, the trading volume exceeded the average figures, shedding light on significant buying activity. South Korean investors played a pivotal role by withdrawing 16 million XRP tokens from exchanges, relocating them to personal wallets, which helped maintain the price above crucial support levels.
Impact of South Korean Purchases on XRP
On-chain data revealed the withdrawal of 16 million XRP tokens, worth approximately $45.5 million, from South Korean exchanges within 24 hours. These withdrawals signify regional institutional demand that offsets individual selling pressures. Historically, South Korea has been a remarkable influencer in speculative cryptocurrency trading, often impacting price directions across markets. Known as the “Kimchi Premium,” this effect occasionally dictates broader market movements.
The accumulation of XRP coins by large regional wallets indicates that the altcoin‘s price finds support at lower levels. Contrastingly, during this period, a $200 million outflow was observed in Dogecoin ![]() $0.06902 investments. South Korean accumulation of XRP thus stands in noticeable contrast to global trends, illustrating a sharp divergence in global distribution and accumulation processes.
$0.06902 investments. South Korean accumulation of XRP thus stands in noticeable contrast to global trends, illustrating a sharp divergence in global distribution and accumulation processes.
Meanwhile, activity within the XRP Ledger surged, evidenced by a 20% increase in active addresses over three days. Additionally, the integration of China-based fintech firm Linklogis’s trillion-dollar supply chain finance platform into the XRP Ledger underscores the strengthening of institutional adoption.
Technical Indicators Enhance the Recovery Outlook
XRP’s price, which briefly plummeted to $2.77 on August 28, quickly rebounded due to strong buying momentum. The 24-hour trading volume soared to 96.19 million coins, doubling the average volume. The $2.85–$2.86 range emerged as a short-term critical support/resistance zone for altcoin. Purchases from this band led the price to commence upward movements by the morning of August 29.
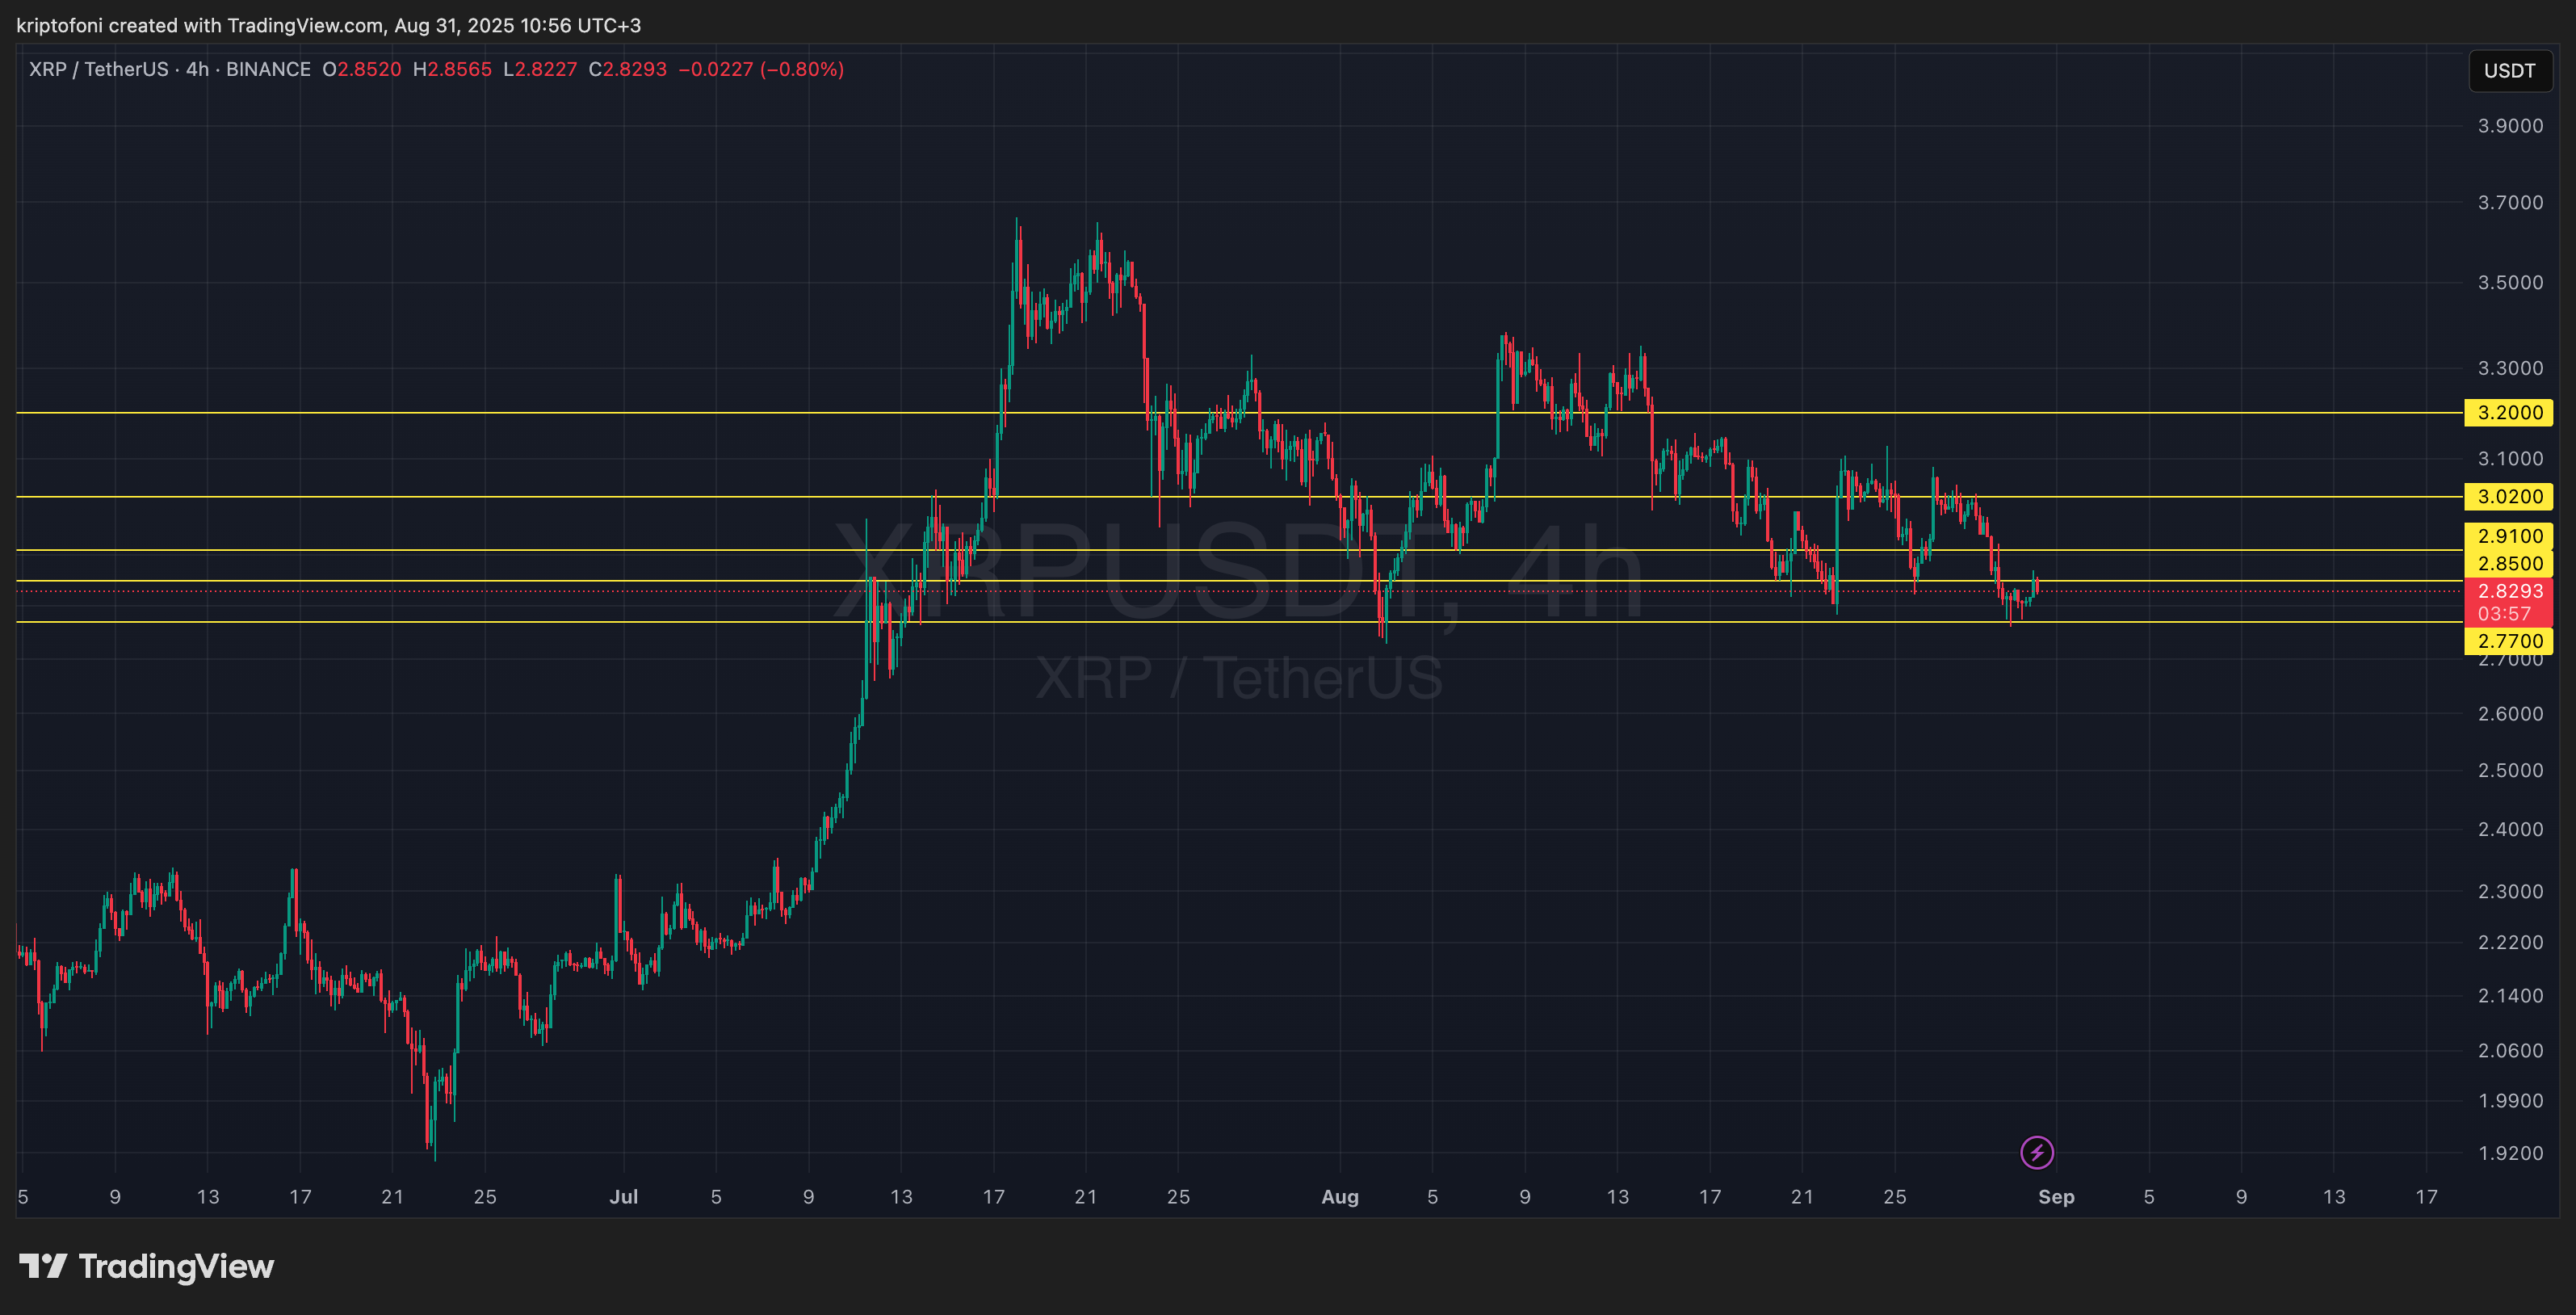
Technical indicators suggest a strong recovery likelihood. The Relative Strength Index (RSI) increased from 42 to above 50, exiting the oversold territory. The narrowing histogram in the MACD indicator suggests a bullish crossover might be imminent if buyers maintain the pressure. Monitoring the $2.91 short-term resistance, the $3.02 mark remains a crucial threshold. A sustained breakout above this level could signal a move toward $3.20.
Some analysts have identified formations like the symmetric triangle and double bottom converging with a broader cup-and-handle formation. Should the cup-and-handle pattern play out, medium-term targets ranging from $5 to $13 could resurface. Nonetheless, the risk of a decline below $2.77, down to $2.70, must not be overlooked.