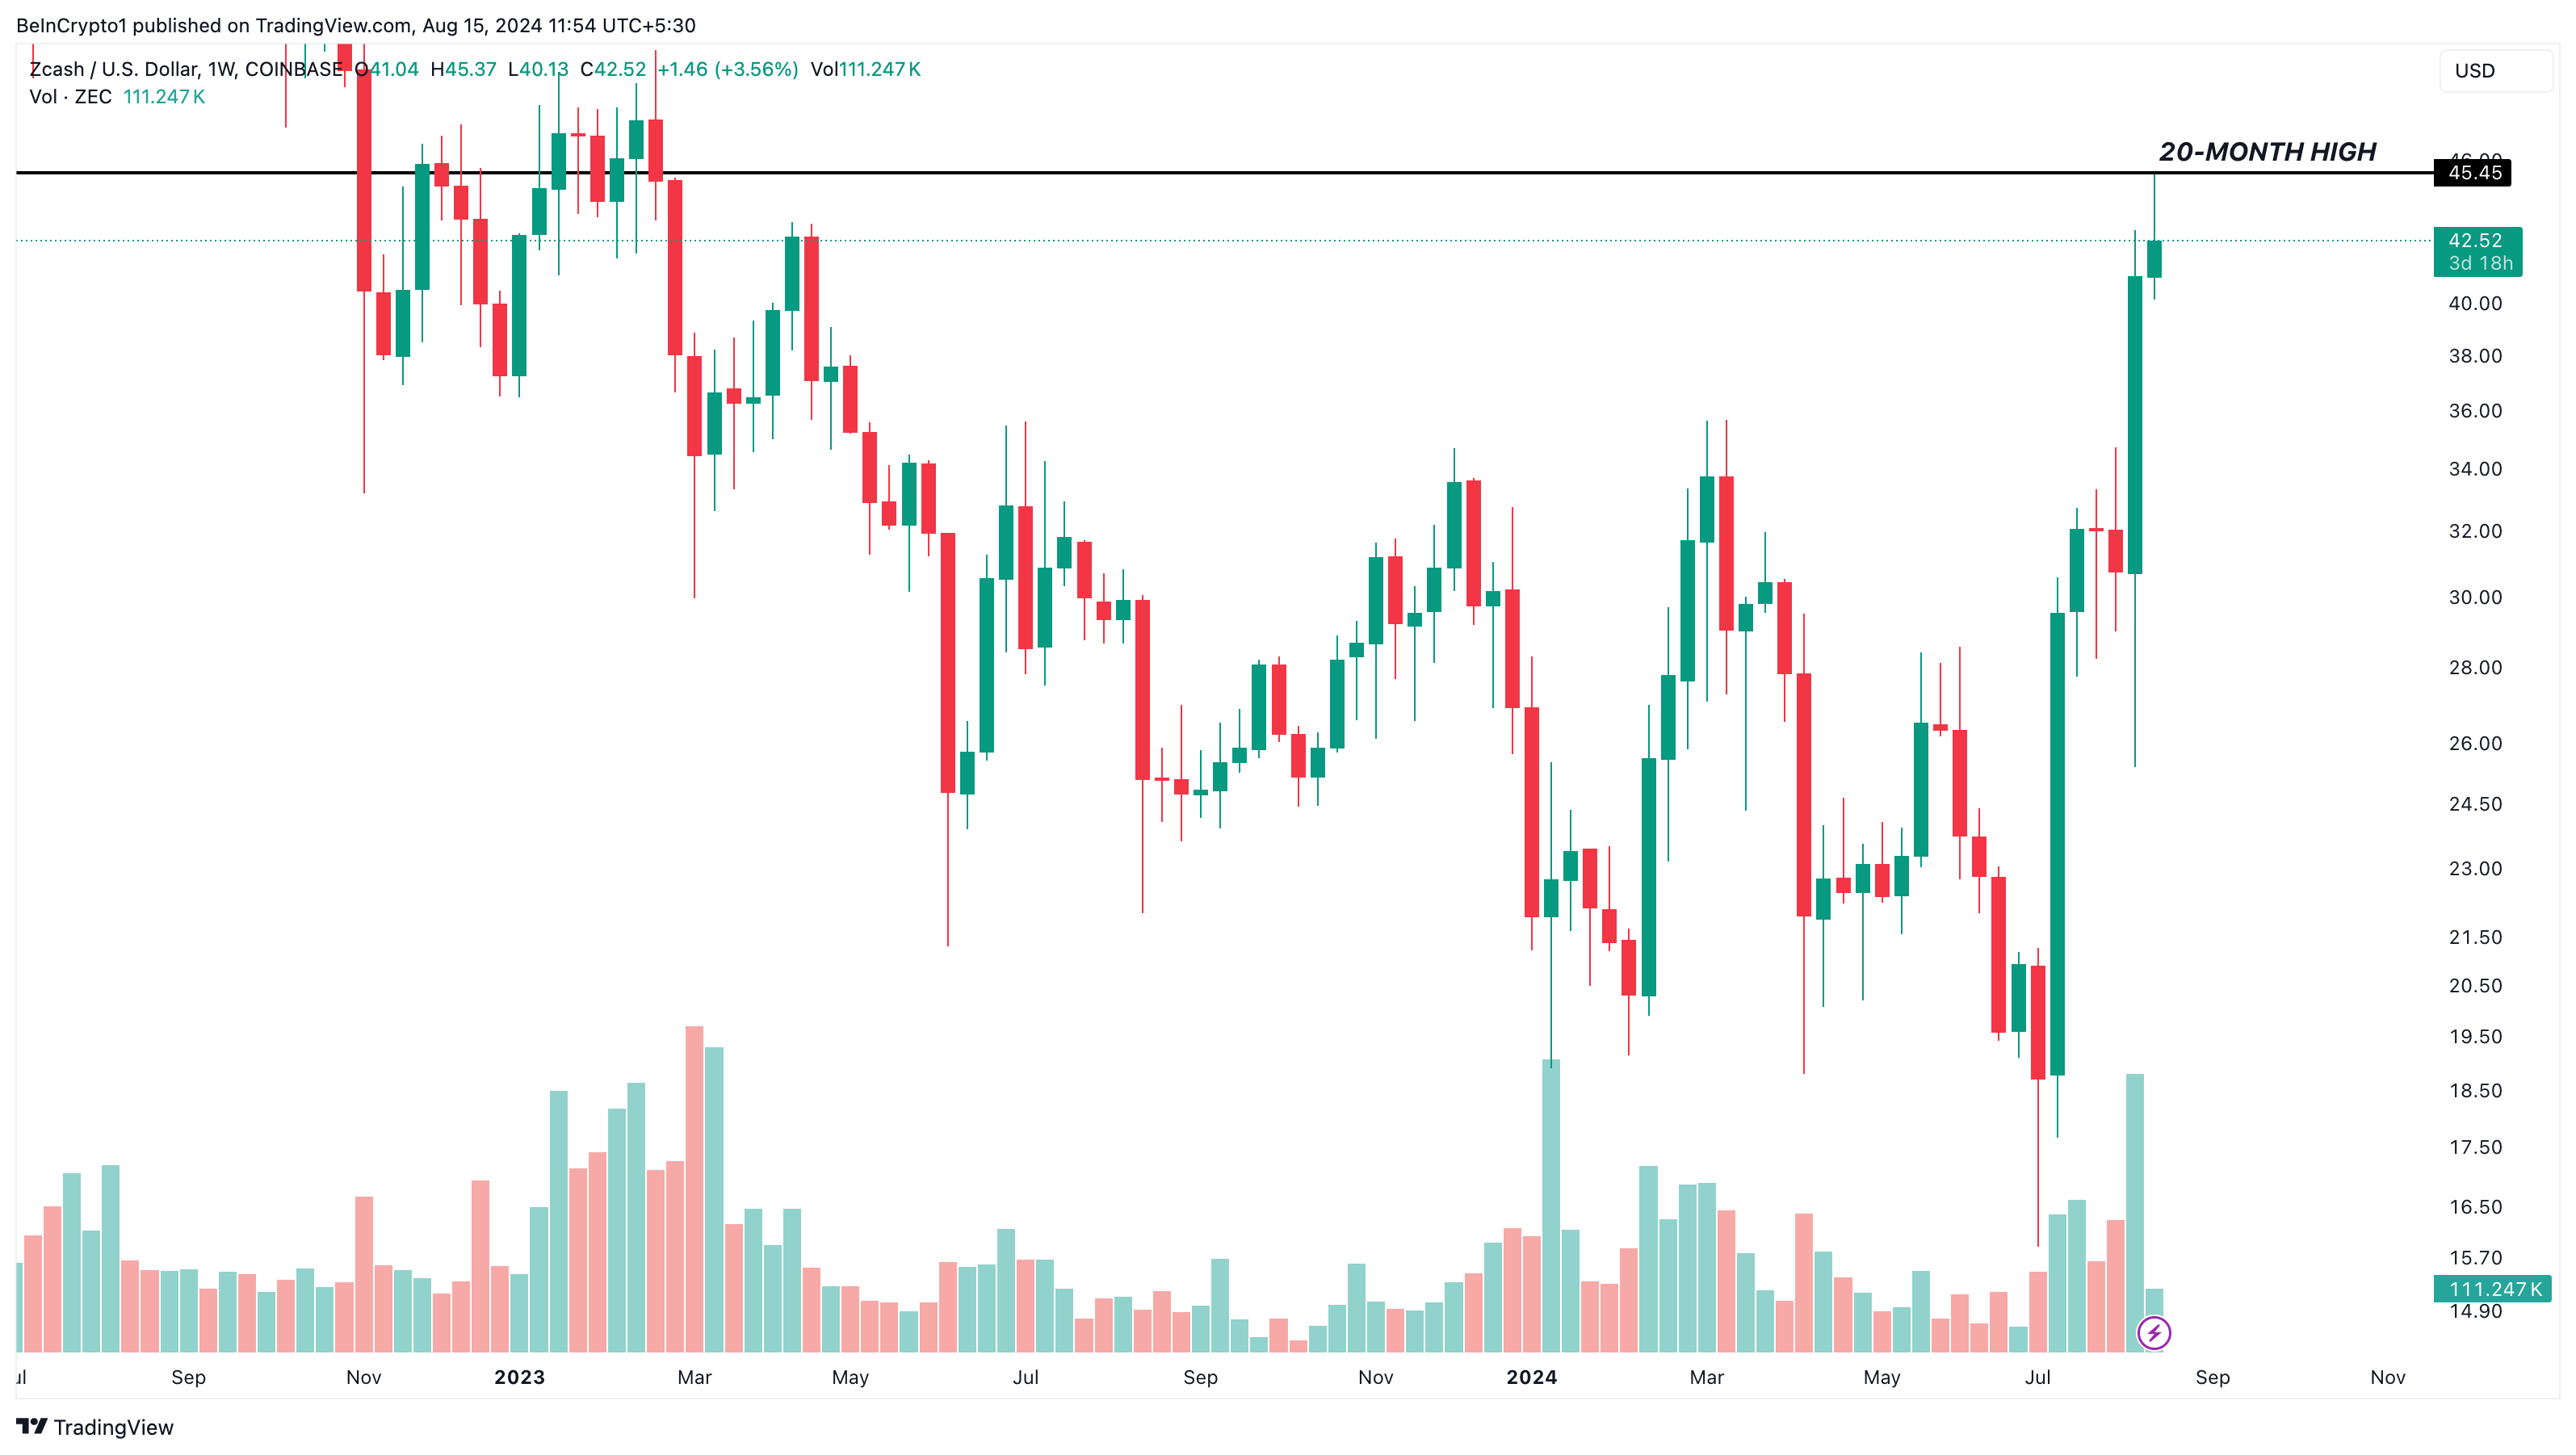
Zcash (ZEC) price continued its upward trend last week, reaching a new annual high on August 12 before a pullback. On that date, the privacy coin hit $45.45. This price marks not only ZEC’s highest level this year but also its peak since March 2023.
What’s Happening with Zcash?
Zcash (ZEC) increased by approximately 45% in the last 30 days and became one of the best-performing altcoins in early August. On July 15, ZEC was trading at $28.54 but has experienced significant growth since then. According to analysts, this increase is not solely driven by buying pressure or general market interest. The fundamental factor behind the rise is speculation about Zcash’s possible transition from Proof-of-Work (PoW) to Proof-of-Stake (PoS). Traditionally, ZEC has relied on a PoW algorithm similar to Bitcoin (BTC).
However, on August 10, the project’s founder Zooko Wilcox hinted at a transition to PoS. Wilcox noted that the creation of new ZEC through PoW has contributed to downward price pressure over the years and that the recent upward trend has started to reverse.

Wilcox, in a statement on Medium, said that the transition to PoS aims to reduce the creation of new tokens, thereby alleviating downward pressure on the ZEC price. The founder explained how PoS would positively affect the cryptocurrency’s value:
“It will allow people to stake their ZEC, thereby increasing demand for ZEC. Additionally, by locking staked ZEC, it will reduce the ZEC supply.”
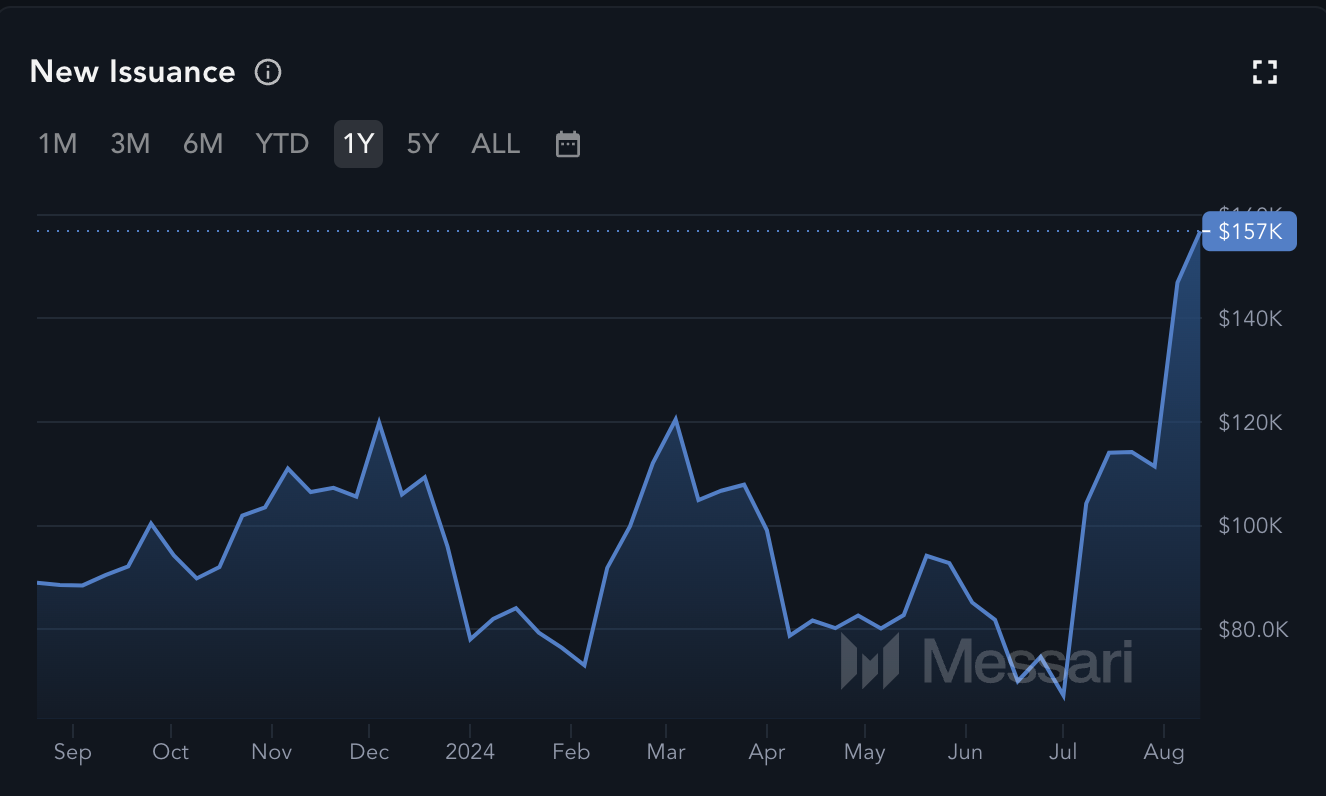
Supporting the founder’s concerns about increasing supply, data from Messari reveals that Zcash’s new issuances have risen to 157,000 tokens as of the date of this writing. On July 1, this figure had fallen below 70,000, indicating a sharp increase in circulating tokens.

ZEC Chart Analysis
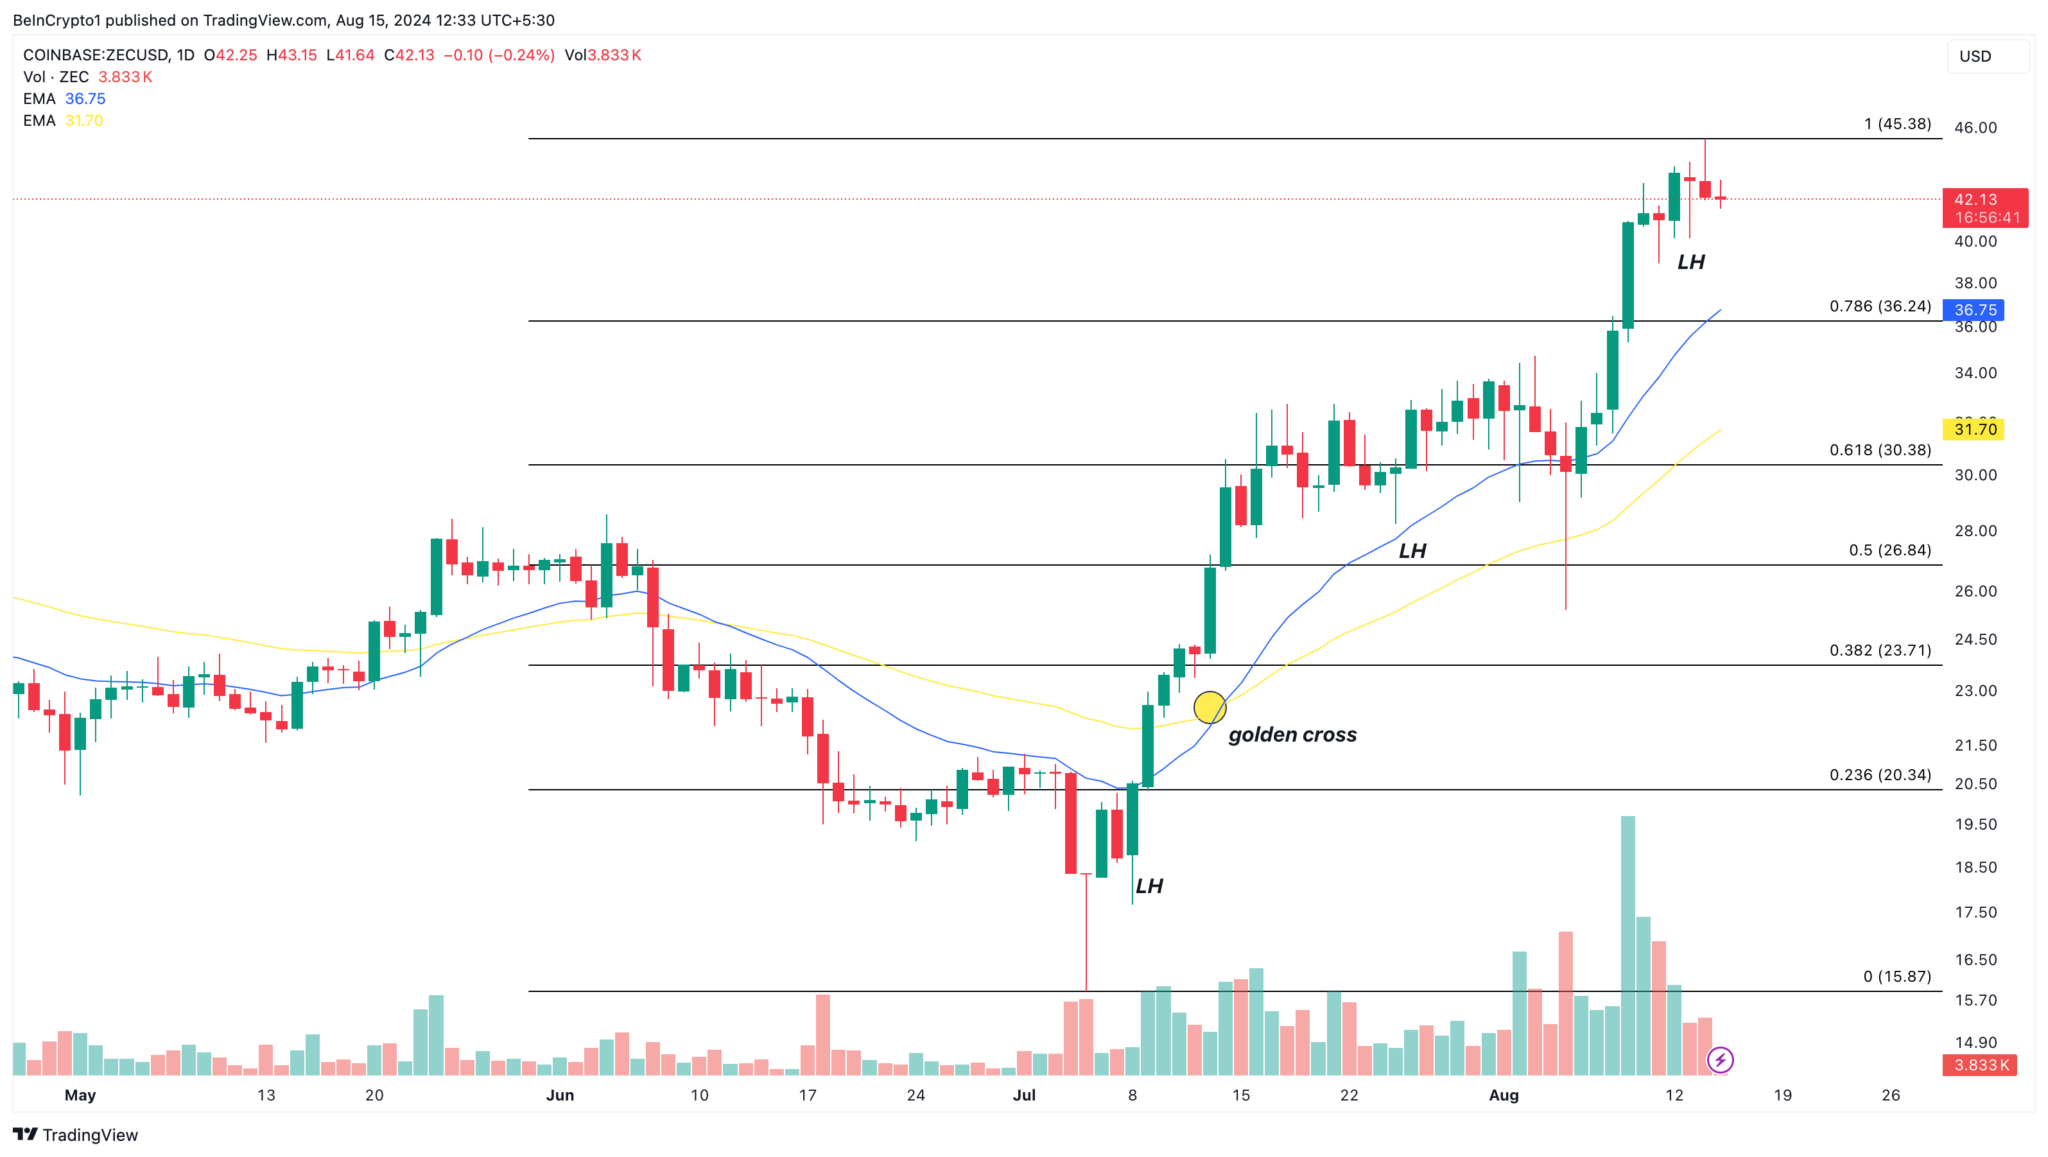
Technically, the daily chart reveals that ZEC‘s price has been forming Lower Highs (LH) since July. This formation indicates strong support almost every time the price increases. Additionally, the Exponential Moving Average (EMA) provides more information about ZEC’s trend. EMA is a technical indicator used to measure trend direction, and when the shorter EMA is positioned above the longer EMA, it indicates an upward trend, while the opposite signals a downward trend.
On July 14, the 20-day EMA (blue) crossed above the 50-day EMA (yellow), forming a golden cross. This pattern generally confirms a bullish outlook, strengthening ZEC’s upward momentum. The shorter EMA continues to outpace the longer one, indicating potential for further gains. If this trend continues, ZEC’s price could reach $46 in the short term.


 Türkçe
 Español


