Cryptocurrency investors are trying to make sense of the developments regarding the spot Bitcoin ETF, while the cryptocurrency market is showing high volatility. As the biggest cryptocurrency reacts sharply in both directions with the news of the ETF, the price of the altcoin king, Ethereum, recovered from the $1,530 support and made a significant move towards $1,600, but this trend was not sustainable. Can the brief rally lead to further decline in Ethereum? Let’s take a closer look. Here is the latest Ethereum analysis.
Ethereum Price Analysis
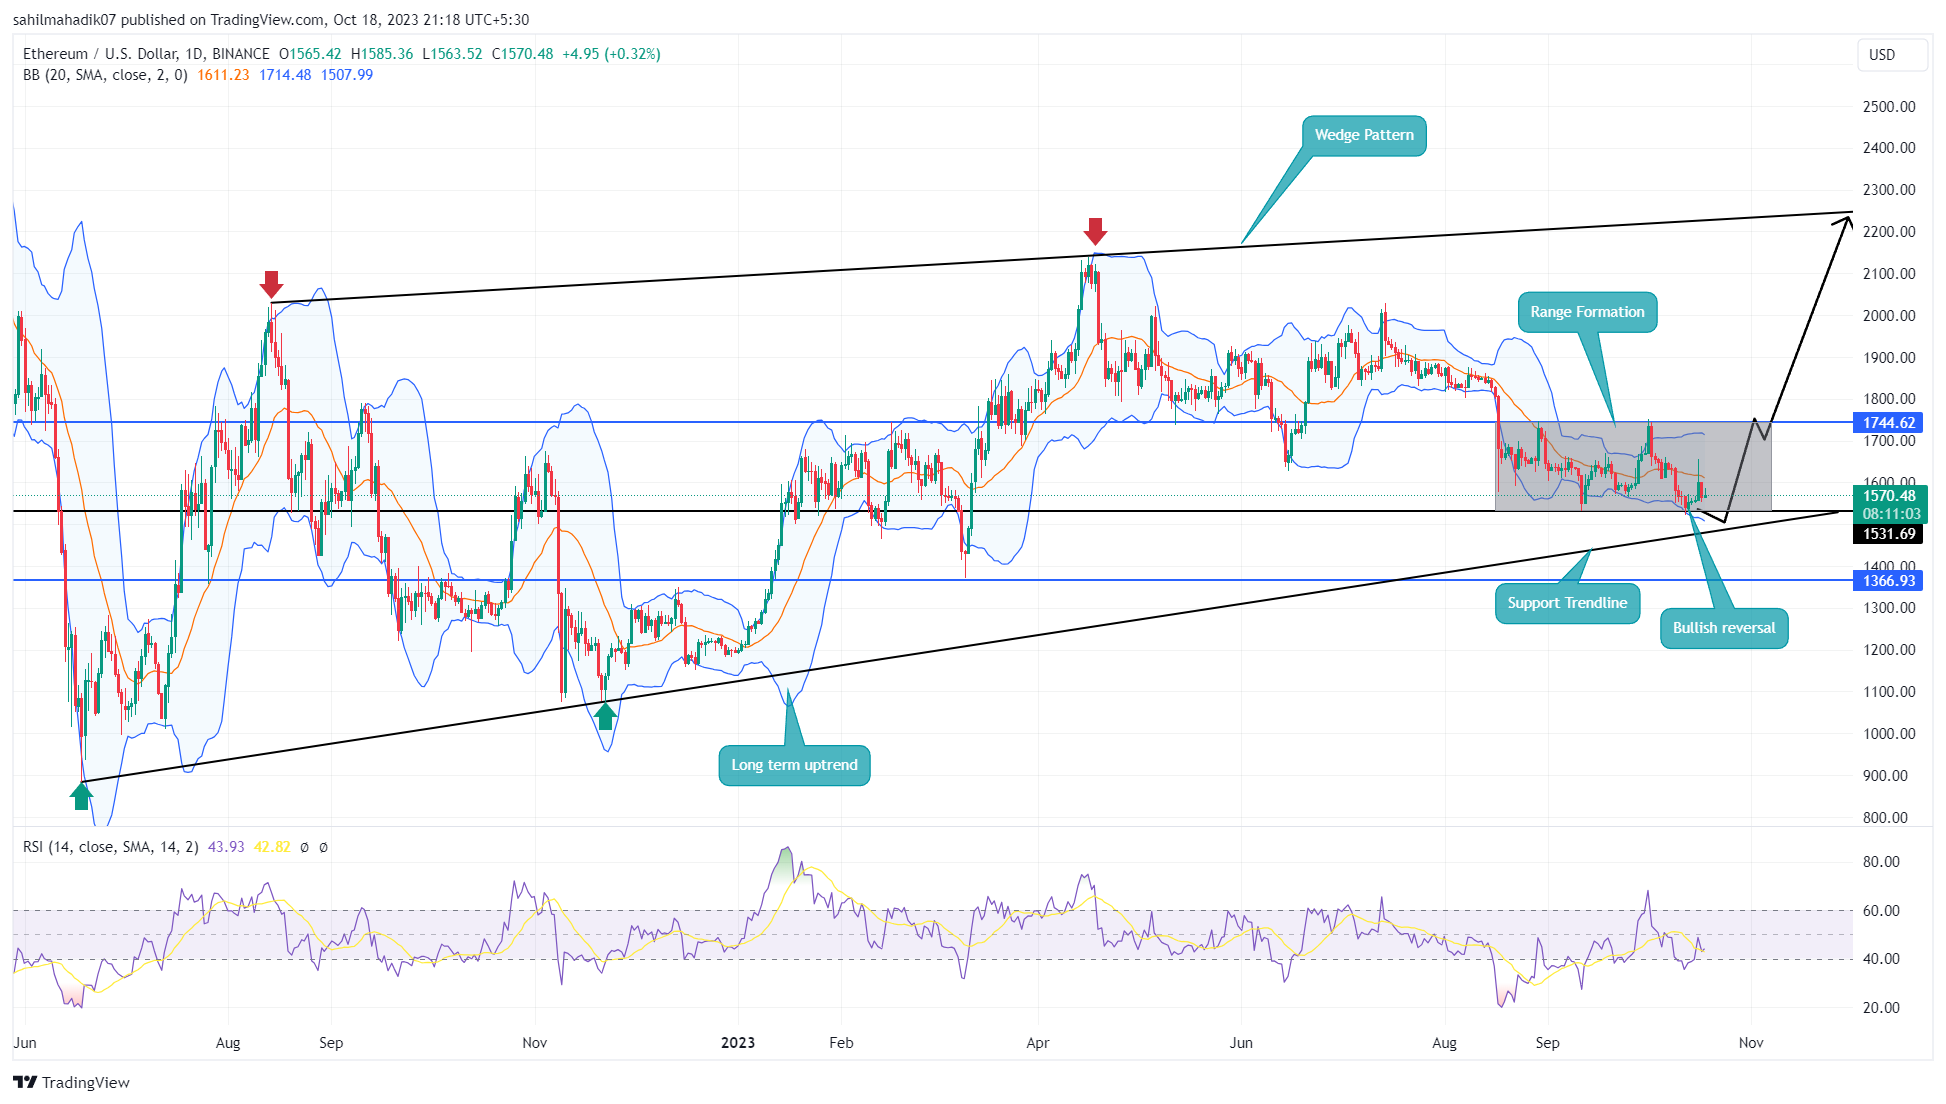
For the past two months, Ethereum’s price has been moving within a narrow horizontal range between $1,745 and $1,630. Despite significant price movements within this range, the altcoin king has failed to make a decisive move in either direction.

The recovery that started from the $1,533 range support on October 13th was met with selling pressure around $1,600, and the rally was capped at this level. The current pause in the recovery indicates that the support level at $1,530 and even the lower trend lines of the rising wedge formation, which has been leading the price movement of ETH for the past 16 months, could be retested.
The potential retest of the lower trend line of the rising wedge formation could increase the demand pressure needed for ETH to break out of the current consolidation. A break above the key resistance level of $1,745 would provide further confirmation for an upward movement. At the time of writing this article, ETH is trading at $1,569 with a 0.05% decrease in the past 24 hours, remaining below the key breakout levels.
Ethereum Analysis
On the daily timeframe, the price movements of ETH have been guided by the rising wedge formation. As long as the two trend lines defining this formation remain intact, the price movements of the altcoin king will be confined to a certain range. On the other hand, a breakdown below the lower boundary of the formation in a bearish scenario could indicate the beginning of a major correction in Ethereum’s price.
The increasing slope of the Relative Strength Index (RSI) on the daily timeframe reflects the growing accumulation around the $1,500 level. Additionally, the flattening of the upper and lower boundaries of the Bollinger Bands (BB) indicator on the same timeframe indicates a sideways trend in ETH.


