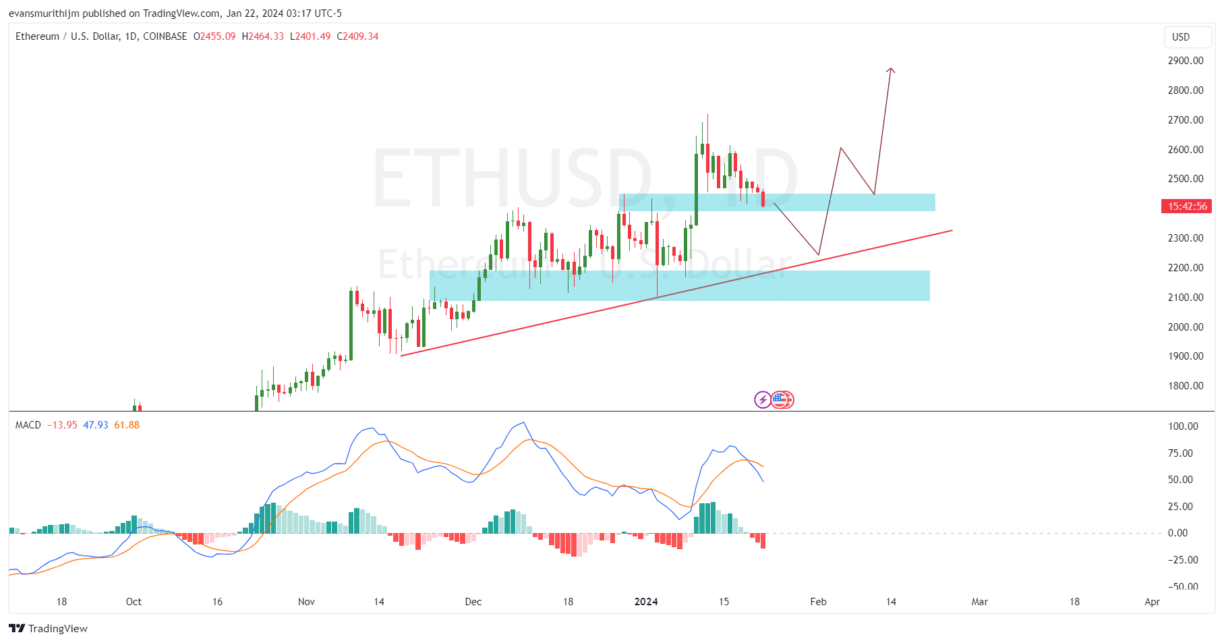
Although the current market outlook points to a bullish trend for Ethereum (ETH), there are short-term bearish signals. ETH is currently trading at $2,368, having fallen by 3.84% in the last 24 hours. Despite this decline, the price of the largest altcoin continues to show significant resilience by staying above the $2,200 level. This suggests that investors remain in anticipation of a strong bullish trend for ETH.
Ethereum Continues to Show Strength
Throughout the past week, the price of ETH fluctuated between $2,300 and $2,400. Despite a 5.5% drop over the weekly period, the current market momentum is upward. Ethereum maintains its position as the largest altcoin with a market value of $285 billion.
ETH is currently the sole focus of crypto investors and market analysts. This is due to experts sharing notable opinions on social media platforms, particularly after speculations that the U.S. Securities and Exchange Commission (SEC) might approve an Ethereum-based spot exchange-traded fund (ETF) within this year, especially by May. Following the initial price movement attributed to ETF approval rumors, Ethereum now appears to be in a consolidation phase. This period is quite valuable for Ethereum to demonstrate its strength after a notable price increase.

If Ethereum manages to stay above the rising trend line at $2,200, it may attempt to break the $3,000 resistance. Overcoming this barrier could lead to the next major hurdle around $3,500. Surpassing this could accelerate the bullish trend, pushing Ethereum towards $4,000. If the upward momentum continues beyond $4,000, the price of the altcoin king could rise to the $4,800 resistance level.
Two Key Levels: $3,000 and $1,900
In a bearish scenario, ETH’s inability to surpass the $3,000 resistance or a drop below $2,200 could trigger further declines. A more significant drop, especially with a candle closing below $1,900, could intensify the downturn, making the $3,000 and $1,900 levels highly significant for determining Ethereum’s short-term market trajectory.
Currently, the daily Moving Average Convergence Divergence (MACD) indicator shows a bullish trend. This is clearly visible as the MACD line is currently above the signal line. However, the daily Relative Strength Index (RSI) is indicating a bearish market environment, with the RSI below the 50 level. The Chaikin Money Flow (CMF) indicator is also positive at 0.11, signaling a short-term bullish pressure.

 Türkçe
 Español


