Bitcoin (BTC), leading the cryptocurrency market, recorded a surprising recovery. In the last 24 hours, Bitcoin maintained a 5% increase and reached $67,000 before pulling back to accumulate more than $66,850 in liquidity.
The Latest on Altcoins
Ethereum (ETH), the second-largest cryptocurrency, rose by 7.5% after reflecting trades at the $3,527 level during US trading hours. Meanwhile, Solana (SOL) was among the biggest gainers as it approached the $200 mark. Meme tokens such as Shiba Inu (SHIB) and Dogecoin (DOGE) also experienced a surge in momentum, supported by growing interest among investors.
Bitcoin’s approach to the $60,000 level from its all-time high affected many investors aside from those taking profits. The bull market momentarily slowed down with experts predicting further losses. As reported in Bitcoin price predictions, there was a noticeable decline in the ETF market this week with several days of negative daily net inflows.
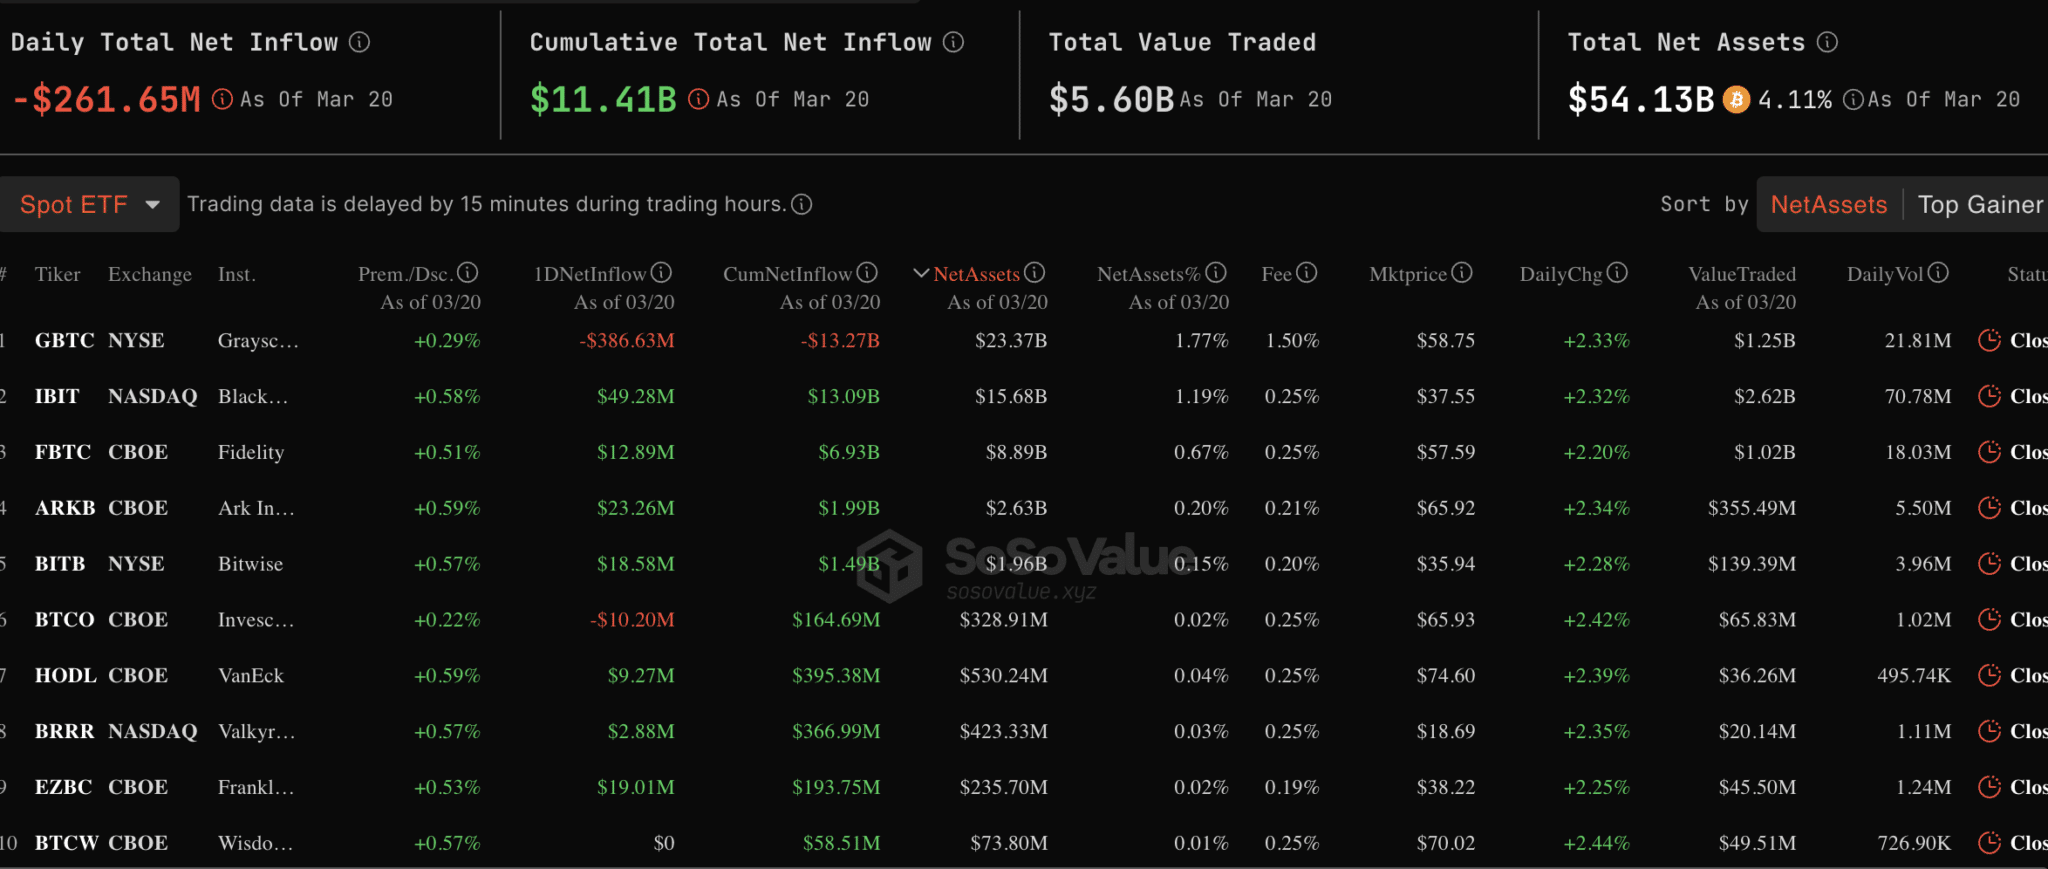
According to SoSoValue data, which shows that the net inflows to all ETFs were at a level of -$261.65 million, ETF volumes continued to fall. Except for Grayscale, which witnessed the largest outflow since the ETF launch, BTCO was the only product trending down with a loss of -$10.2 million as of March 20. Although the cumulative total net inflow reached $11.41 billion, ongoing outflows could be concerning, especially for investors buying BTC due to improved sentiment.

Current Data on Bitcoin
Despite the concerning aspect of Bitcoin ETFs, Bitcoin today rose above $67,000, bringing most altcoins along with it. Since it is positioned above all critical moving averages, including the 200-day exponential moving average (EMA), 50-day EMA, and 20-day EMA, the previously critical structure could find new life for gains above $70,000. The Relative Strength Index (RSI) presents a bullish outlook, but it cannot be fully trusted until it breaks above the declining trend line resistance. Bitcoin’s movement above $70,000 could also be supported by a break above the dotted trend line.
If support at the 50-day EMA weakens due to profit-taking, it would be reasonable to expect Bitcoin to find another lower support area for dollar-cost averaging. Potential support areas in a new downturn include the 20-day EMA at $65,940, the 200-day EMA currently at $62,430, and the continuous trend line. The Moving Average Convergence Divergence (MACD) could strengthen the uptrend after confirming a buy signal on the four-hour chart. As long as the blue MACD line remains above the red signal line and the histograms stay green, it is likely that investors will continue buying BTC.

 Türkçe
 Español


