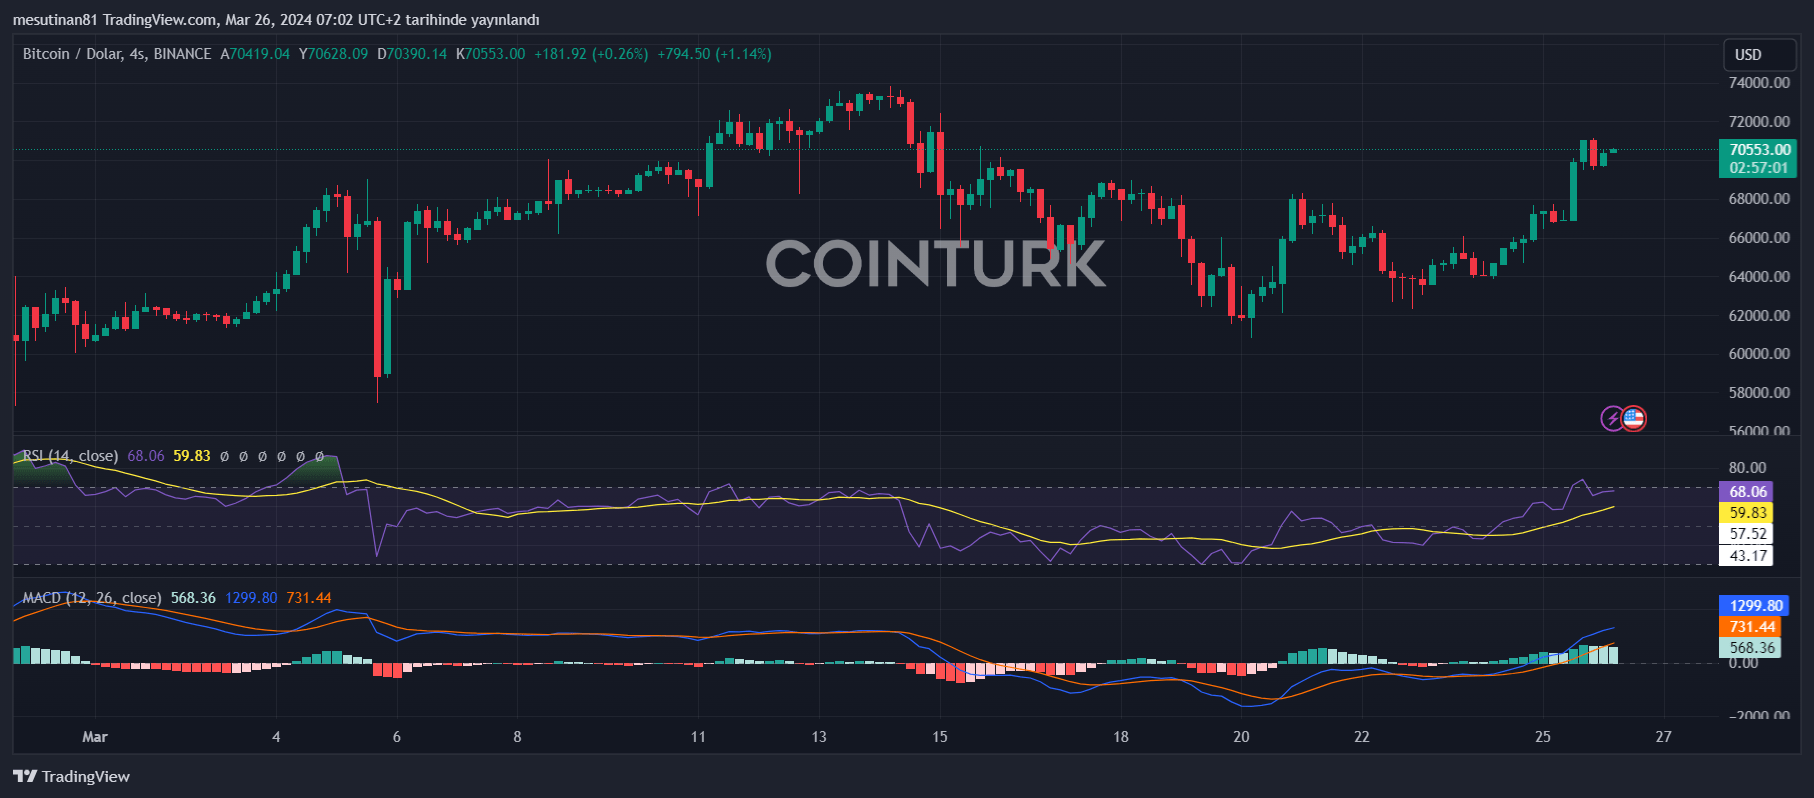
The cryptocurrency market experienced exciting times since last evening. Bitcoin’s price exhibited a strong performance above the $70,000 resistance level. Currently trading above $70,500, BTC could continue to rise towards the $73,000 and $75,000 levels in the near term.
Which Levels Should Be Monitored in Bitcoin Price?
According to the latest data, Bitcoin‘s price is in a positive zone above the $66,500 level and is trading above $70,500. Moreover, being above the 100-hour Simple Moving Average can also be interpreted as a strong bullish signal.
On the hourly chart of the BTC/USD pair, a rising trend line with support near $67,500 is noteworthy. This trend line indicates that Bitcoin’s recent rise is near the 76.4% Fibonacci retracement level.
Currently, the immediate resistance Bitcoin faces is near the $70,700 level. However, if it surpasses the larger resistance level of $71,200, the price is expected to gain strength and continue its upward trend. In this case, it is possible for Bitcoin to surpass the $73,500 resistance zone and move towards $75,000.
If There Is a Downward Movement in BTC
A point of interest here is Bitcoin’s inability to break above the $71,200 resistance zone. If this level is not surpassed, eyes may turn back to a downward trend. So, what should we expect for BTC in the coming days?
BTC/USD pair’s recent price movements show that an immediate support level is near $70,000. However, a drop below the significant support point of $69,000 could create more selling pressure in the market. Nonetheless, the support level and trend line at $67,800 could prevent further declines in price.

Yet, if a close below this level occurs, it wouldn’t be wrong to say that a drop to $66,800 is imminent. Moreover, this downward trend could continue in the short term to the support zone at $65,500.
What Do Technical Indicators Suggest?
Looking at the technical indicators, we see that the hourly MACD is losing momentum in the bullish zone. However, the hourly RSI (Relative Strength Index) is above the 60 level for BTC/USD, which indicates some bullish momentum.
Considering the fundamental support and resistance levels in the market, it is important to note that the $69,000 and $67,800 levels are of critical importance. Movements below or above these levels can provide a clearer idea of BTC’s direction in the short term.

 Türkçe
 Español


