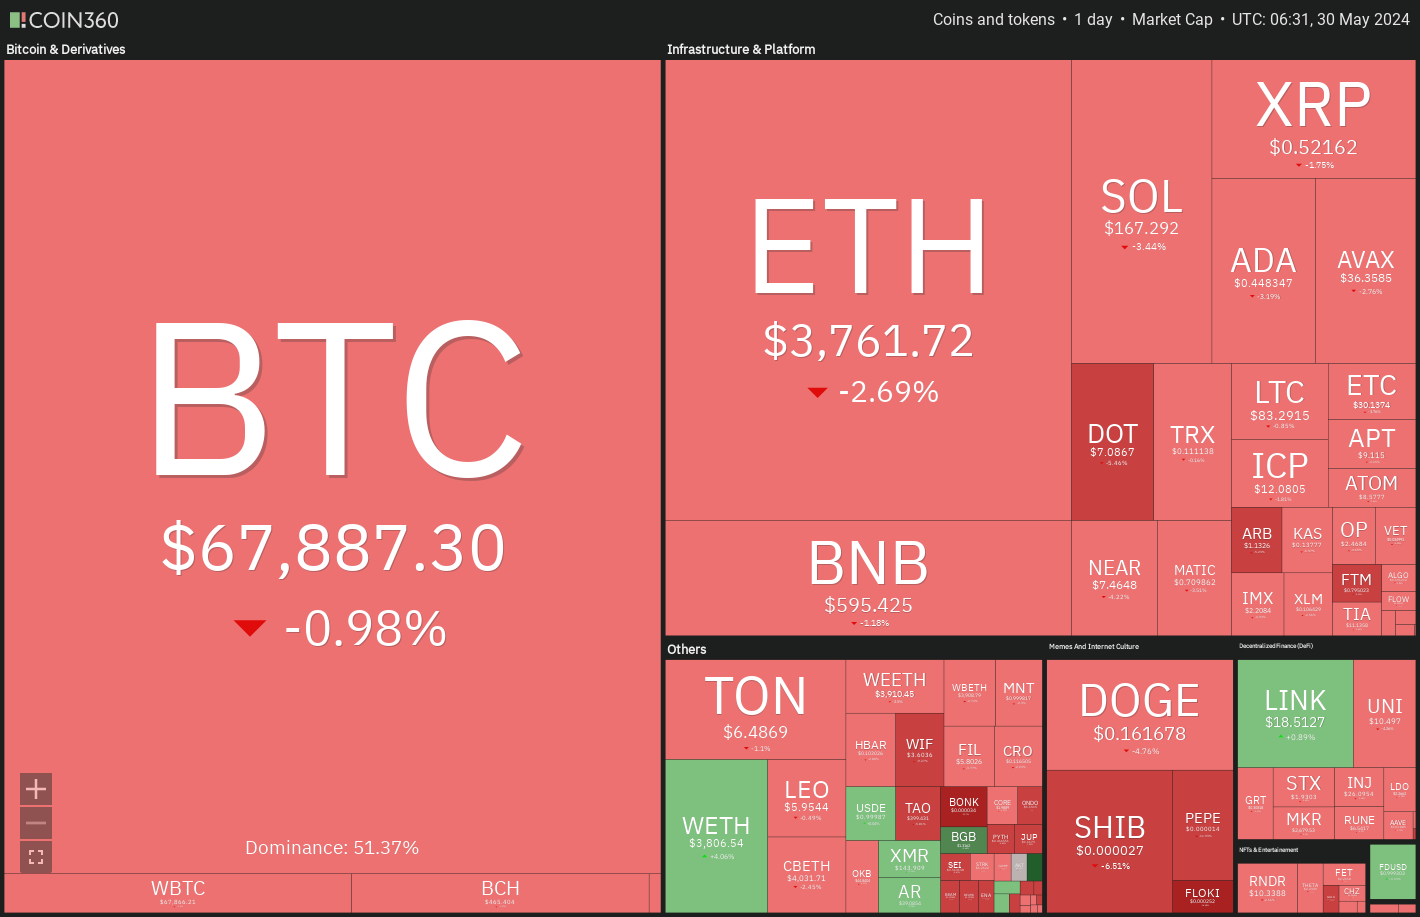
Bitcoin remains in a sideways price movement, but investors continue to buy spot Bitcoin ETFs, which is a positive sign. Farside Investors data shows net positive inflows into ETF funds over the past 11 days. CoinShares data indicates over $1 billion flowed into Bitcoin investment products last week. Institutional investors and whales are also accumulating Bitcoin. Glassnode analysts reported in The Week On-chain that long-term investors have started reaccumulating coins for the first time since December 2023.

According to Securities and Exchange Commission filings, over 600 US investment firms have invested in spot Bitcoin ETFs since January. ETF funds have purchased 855,619 Bitcoins, averaging 6,200 Bitcoins per day since their launch.
Bitcoin Chart Analysis
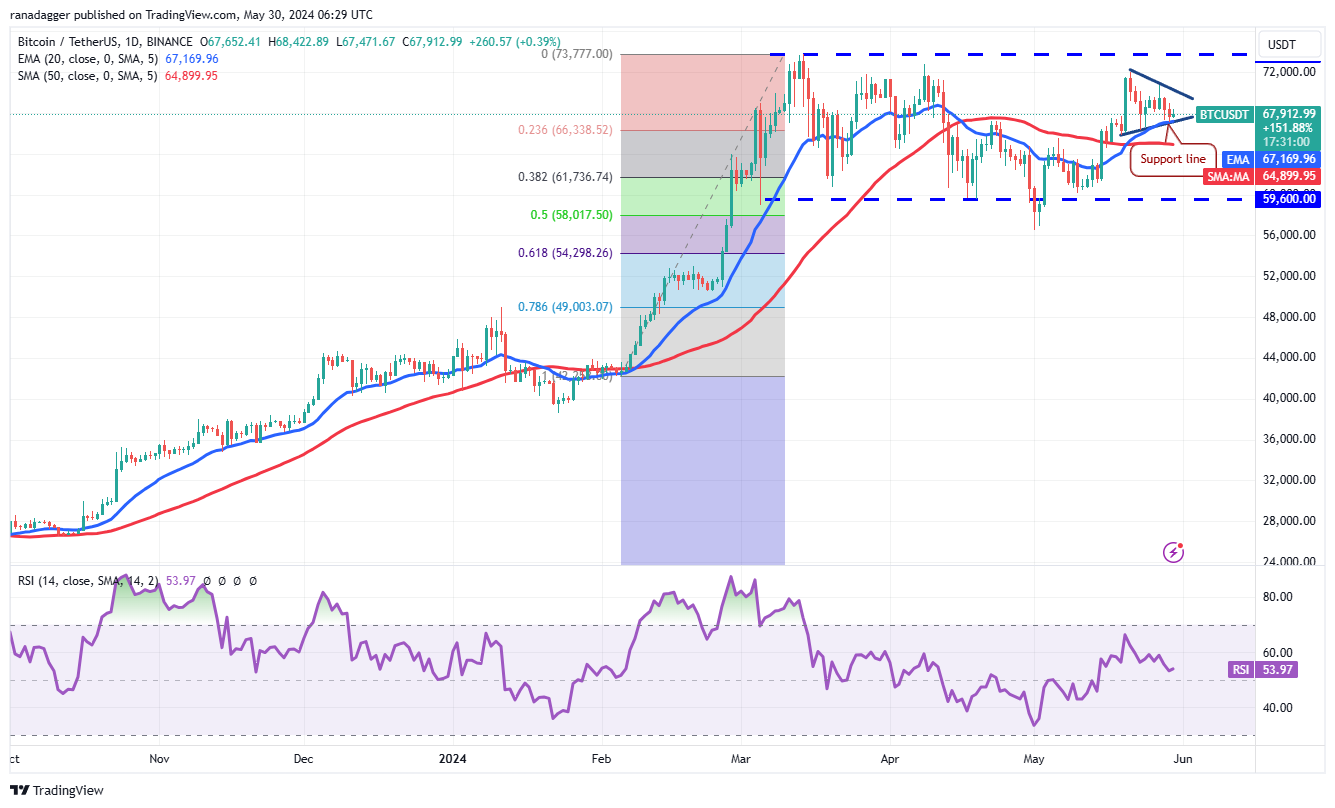
The bulls’ failure to keep the price above $70,000 has pulled Bitcoin to its 20-day exponential moving average of $67,169. Recent price movements have formed a symmetrical triangle. A break below the triangle will signal a shift in advantage to the bears. The pair could drop to $64,600 and eventually to $59,600.

Conversely, if the price bounces off the support line and breaks above the triangle, it will indicate that the bulls are in control. The pair will then attempt to move to $73,777. If the bulls overcome this hurdle, the rise could reach $80,000.
Ethereum Chart Analysis
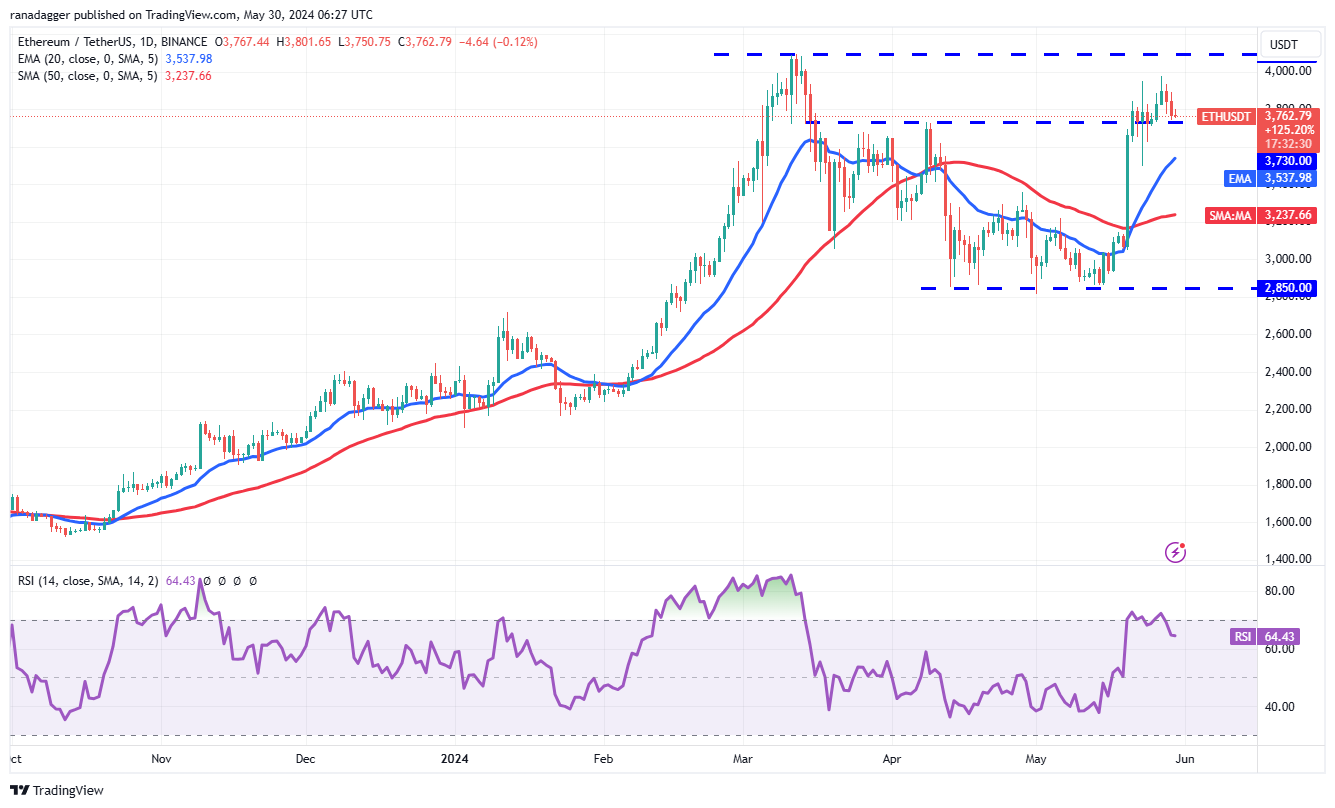
Ethereum retreated from $3,977 on May 27, signaling that the bears are fiercely defending the $4,000 to $4,100 resistance zone. The first support on the downside is the $3,730 breakout level. If the bulls turn this level into support, the ETH/USDT pair will make another attempt to break above the $4,100 resistance. If this level is surpassed, the pair could rise to $4,868.

Conversely, if the price continues to fall and drops below $3,730, it will signal that the bears are trying to make a comeback. The pair could then drop to the 20-day EMA of $3,537 and subsequently to $3,050.

 Türkçe
 Español


