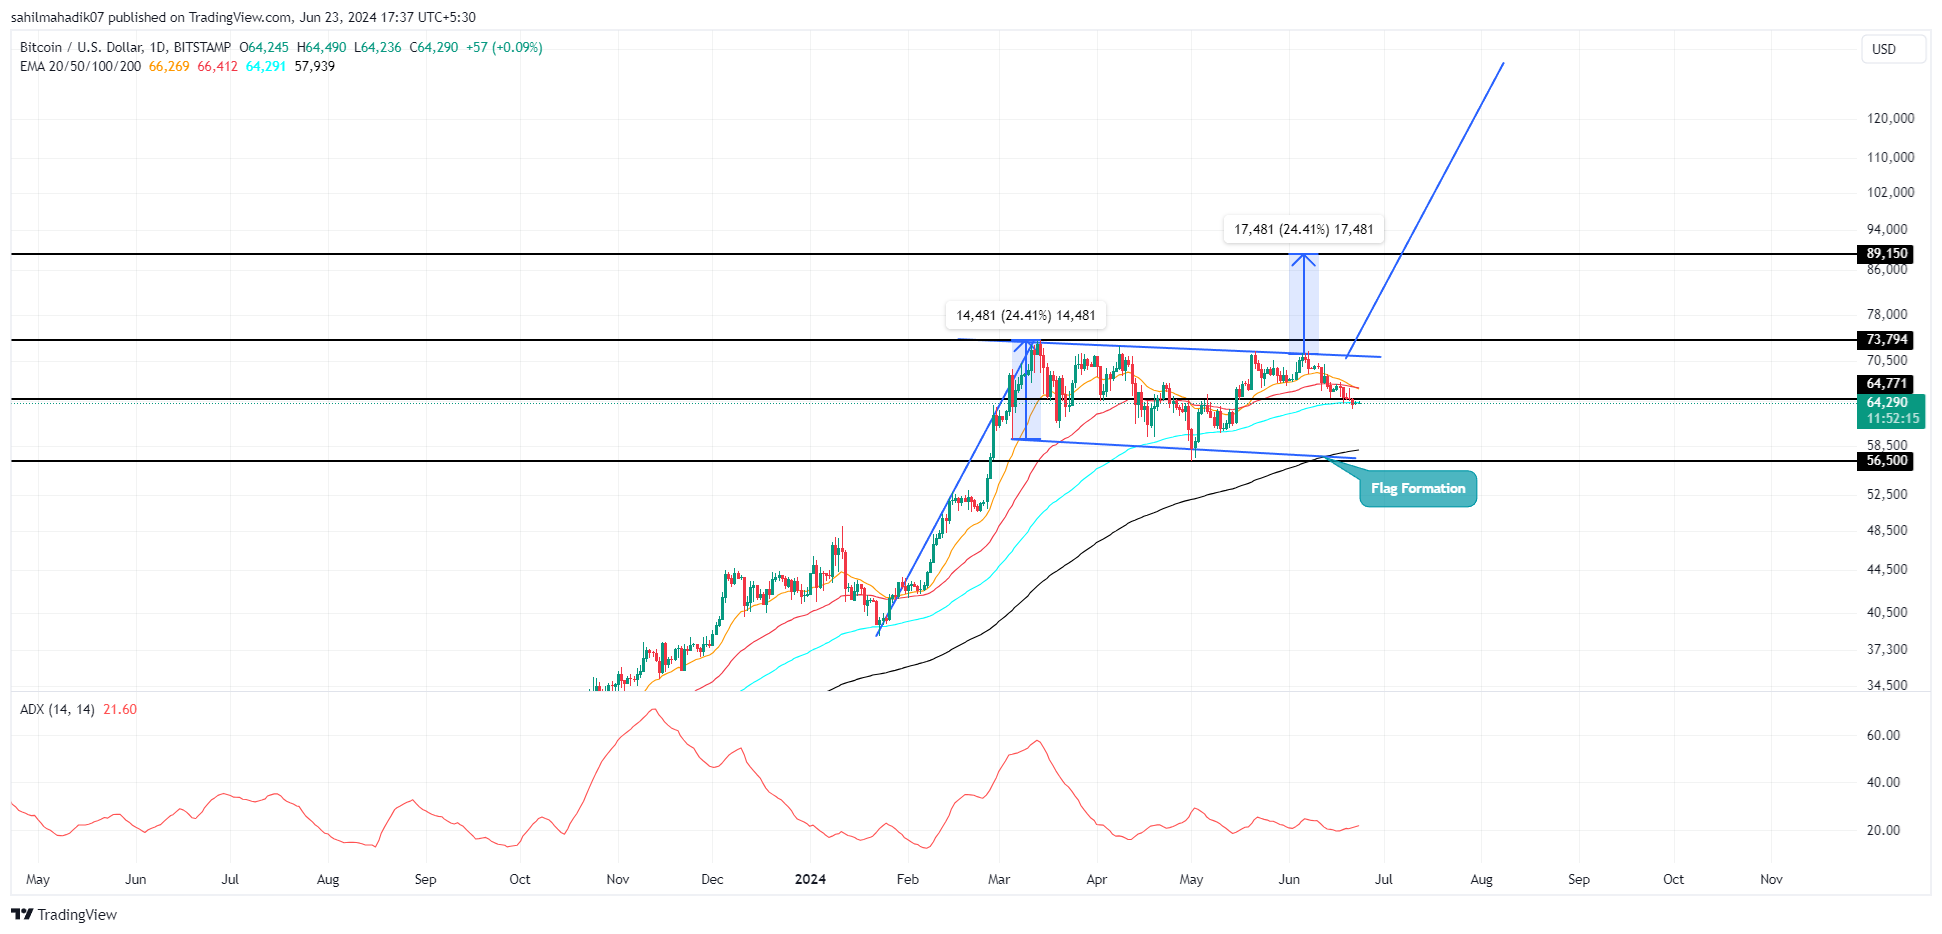
Bitcoin daily chart shows reduced volatility over the weekend, as indicated by doji candles. The easing selling pressure halted the correction trend in altcoins, with many revisiting critical monthly support levels. However, Bitcoin’s continuous outflows from US-listed ETF funds and miner capitulation could potentially pull the asset below $60,000.
What’s Happening on the Bitcoin Front?
Bitcoin’s current correction trend began in the second week after the price retraced from $72,000. The downward trend caused the asset to trade at $64,275, a 10.7% drop, while the market cap fell to $1.267 trillion.

Additionally, according to blockchain analysis firm IntoTheBlock, Bitcoin miners sold over 30,000 Bitcoins in June, equivalent to approximately $2 billion, marking the fastest selling rate in over a year. This significant selling wave followed the recent Bitcoin halving event, which tightened miners’ profit margins and led to substantial reserve liquidations.

However, daily chart analysis shows this correction as part of a horizontal trend in a flag formation. Two trend lines acting as dynamic resistance and support are key factors affecting Bitcoin price movement.
Notable Prediction for Bitcoin
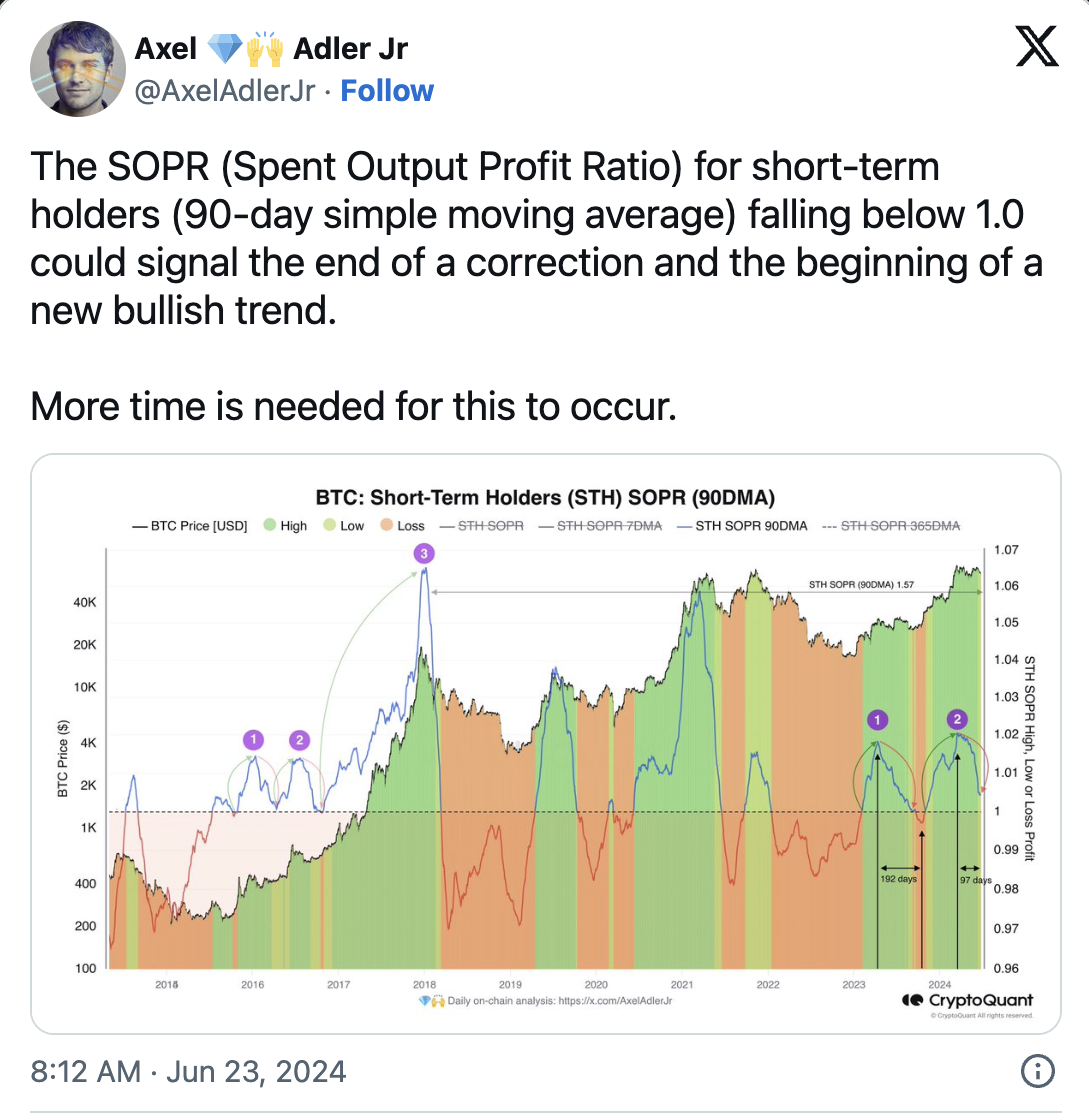
During this period, blockchain data analysis platform CryptoQuant writer Axel Adler Jr. highlighted that the SOPR data for short-term holders fell below 1.0 based on the 90-day moving average. This could indicate the end of the current market correction and the beginning of a new upward trend.

SOPR is tracked as a metric measuring Bitcoin holders’ profits and losses, with a value below 1.0 indicating sales at a loss; this often signals the market bottom and potential reversal. Therefore, with a broader upward trend, Bitcoin is likely to surpass the flag pattern with a decisive breakout. A successful resistance break could push Bitcoin’s price up to $89,150, resulting in an increase of nearly $13,500.

 Türkçe
 Español


