The effects of the drop that occurred on the night of August 18 continue to resonate in the cryptocurrency sector. The cryptocurrency market experienced a significant drop within minutes due to the claim that Elon Musk’s aerospace and space company SpaceX sold its Bitcoins, and then investors who bought the dip managed to reduce some of their losses with the news that the SEC will approve Ethereum ETF applications. The altcoin market, on the other hand, continues to maintain its calmness due to market volume shortage after the drop.
Solana Chart Analysis
The first notable formation on the 1-hour chart is a triangle formation. The fact that the line works as support for 4 bars after the resistance breakout proves the strength of this formation. The price, which is above the EMA 21 and EMA 7 averages on the 1-hour chart, can trigger an upward movement.
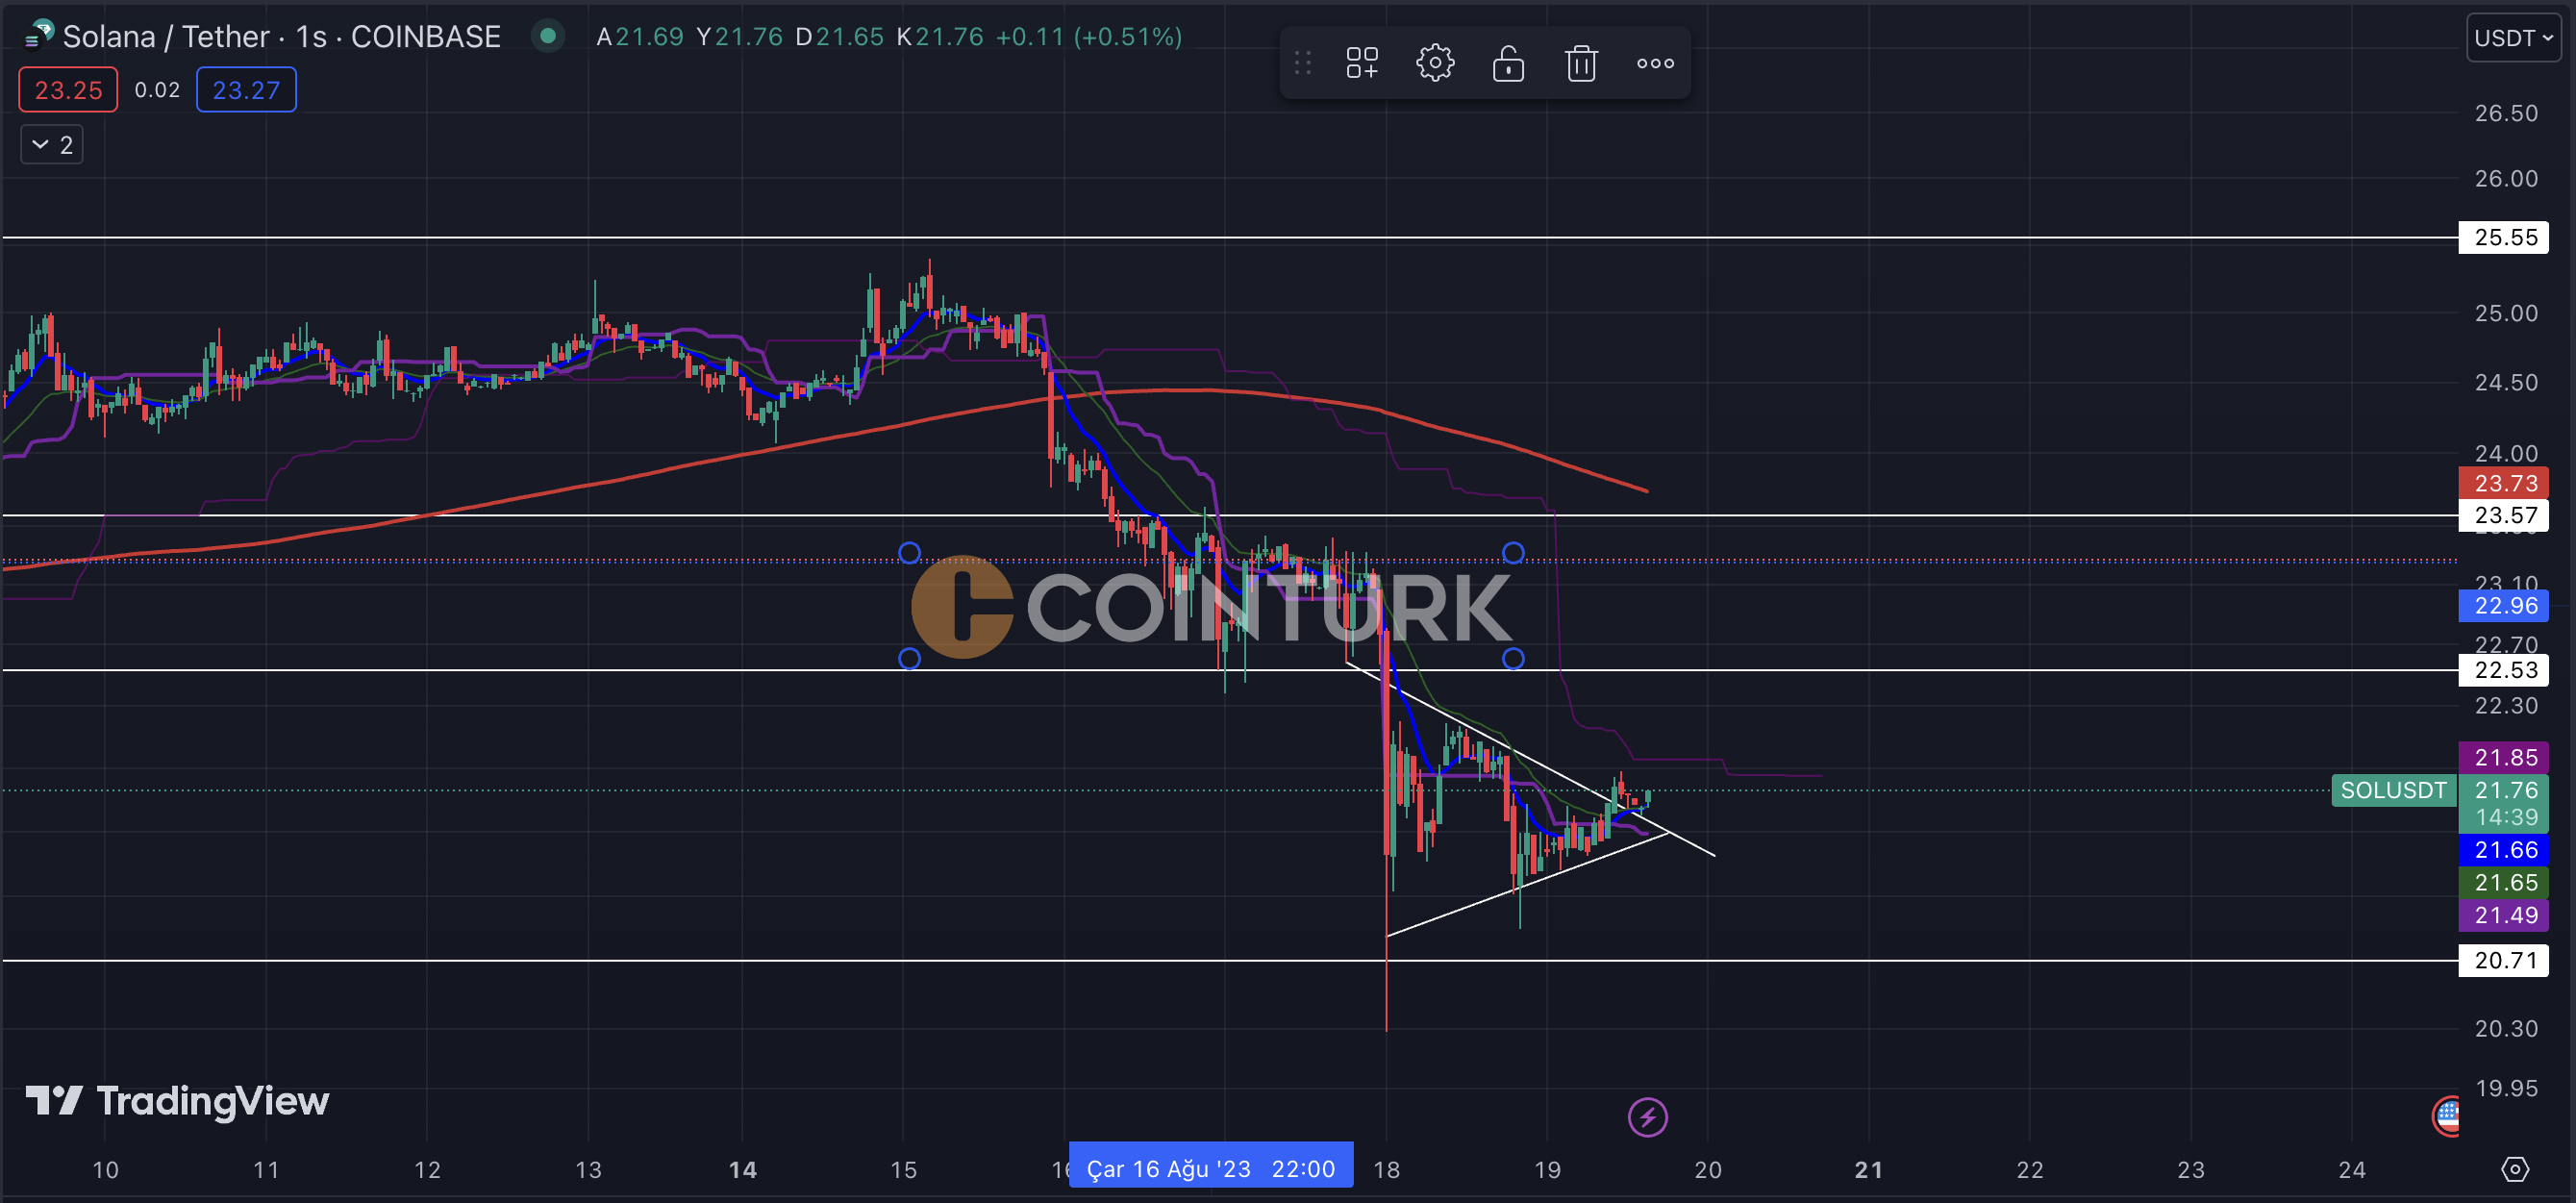
In the Solana chart, the resistance levels are respectively $21.85, $22.53, and the EMA 200 average at $23.73. The support levels are respectively $21.49 (formation support), $21, and the most important support level, which acted as support during the drop on July 10, at $20.71.
Avax Chart Analysis
Currently, there is no notable formation in the Avax chart, which caught my attention with its ascending triangle formation on the daily chart in my previous analysis. Due to the methods called bull trap and bear trap, which are used to mislead investors in technical analysis, keeping the time frame high is of great importance in the cryptocurrency market.
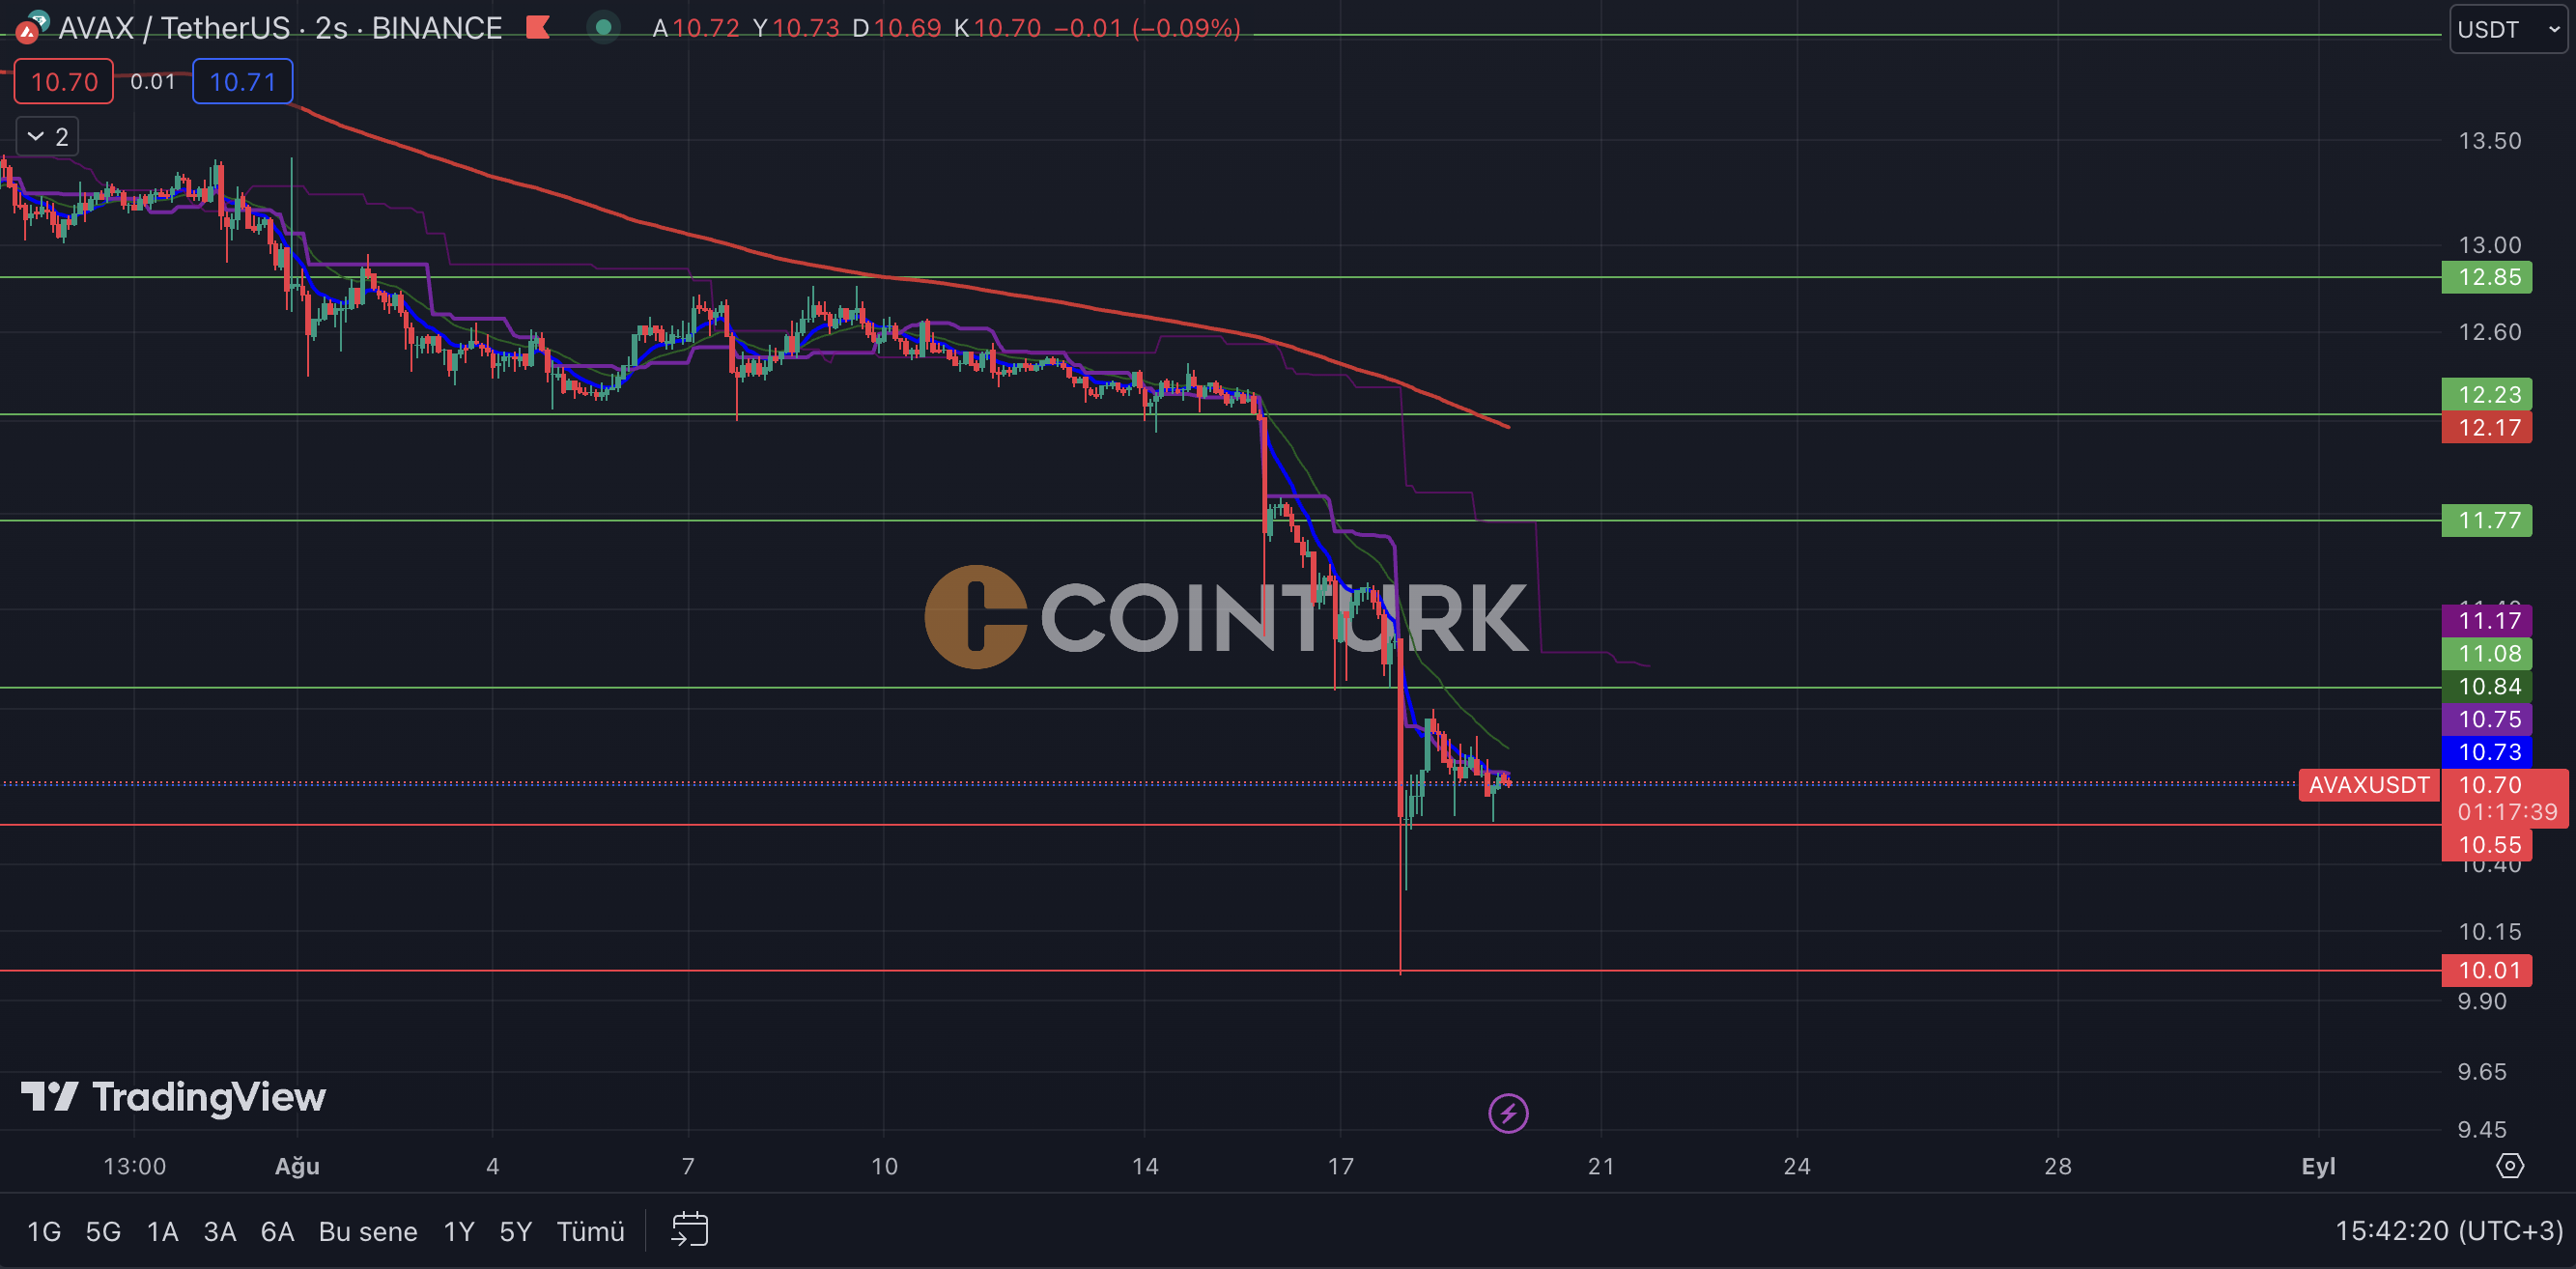
In the Avax chart, the support levels are respectively $10.55 and $10.01. The $10.55 level has had 6 touches in a 24-hour time frame, but the price did not close below this level. The $10.01 level is the most important support level to be considered as it worked during the drop on July 10. The resistance levels are respectively $10.84, $11.08, $11.77, and $12.23.
Luna Chart Analysis
The price of Luna, which was trading at $0.00007689 and $0.00008100 levels before the drop, experienced a nearly 30% loss in the altcoin market, making it one of the most declining crypto assets. The Luna price, which managed to break the downtrend on the 2-hour chart, also provides confidence to its investors by trading above the EMA 21 and EMA 7 averages.
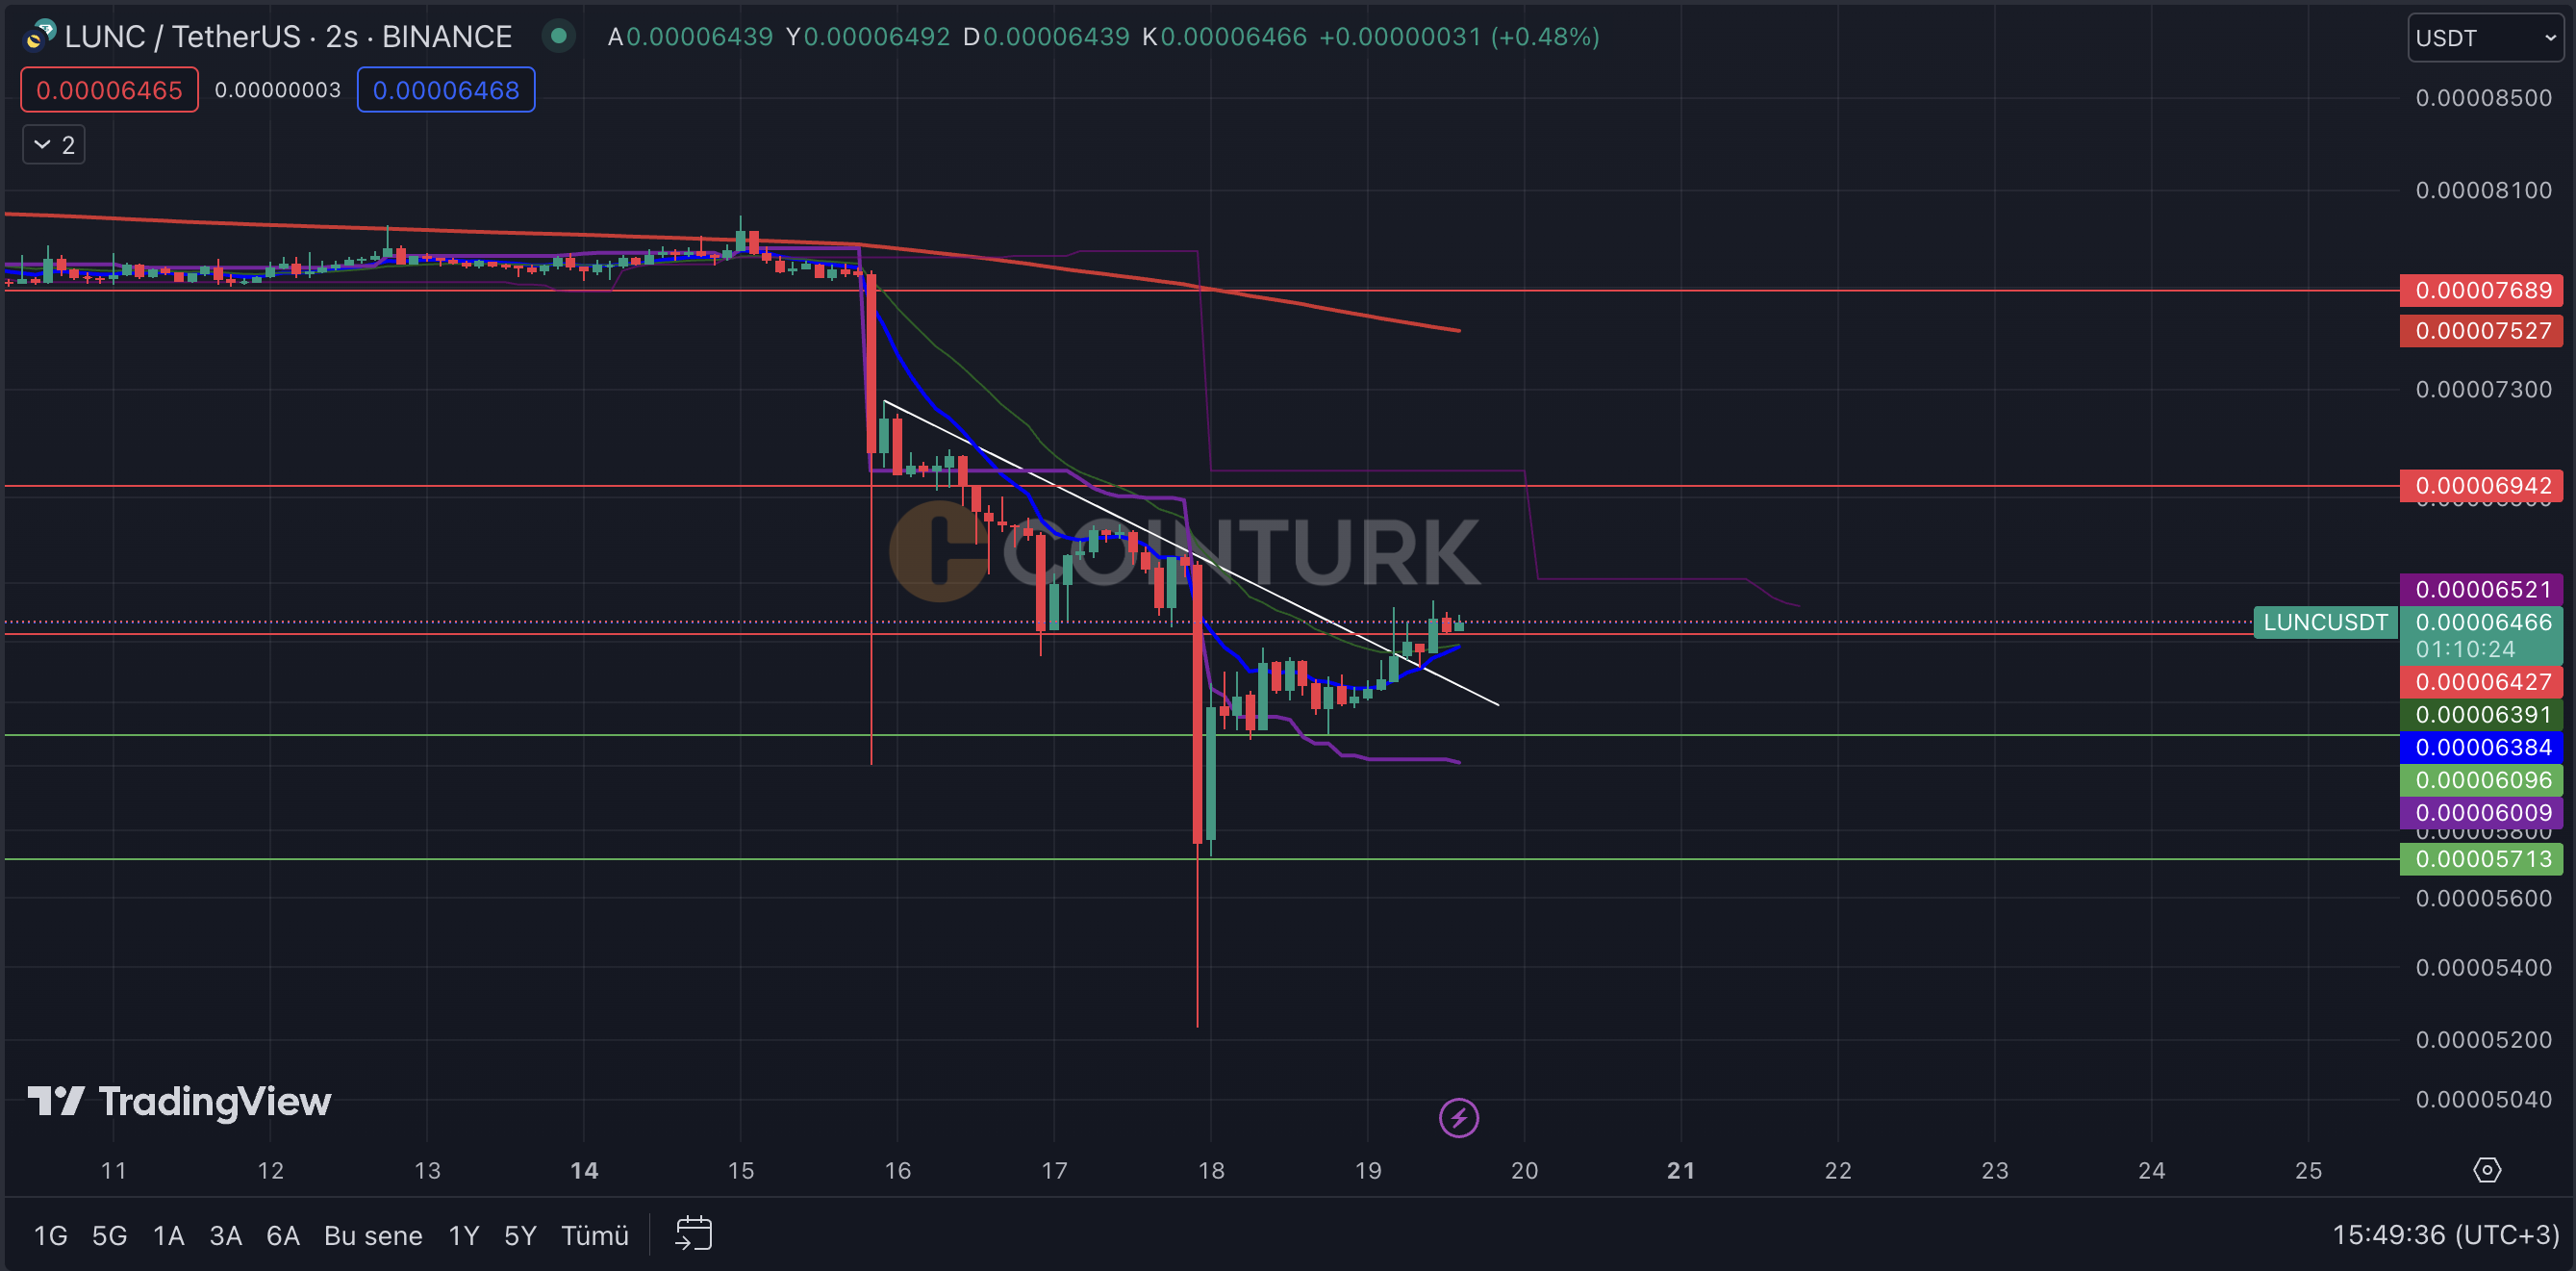
The resistance levels in the Luna chart are respectively $0.00006521, $0.00006942, and $0.00007527. The support levels are respectively $0.00006384, $0.00006096, and the most important support level that has worked twice before, $0.00005713.


