Since the mid-August cryptocurrency market crash, the price of Ethereum (ETH) has been on a downward trend. The massive sell-offs across cryptocurrencies have shattered the confidence of remaining investors. Decreased demand in futures has led to a decrease in volatility. There has also been a significant decrease in trading volume in spot markets.
Current Situation of Ethereum (ETH)
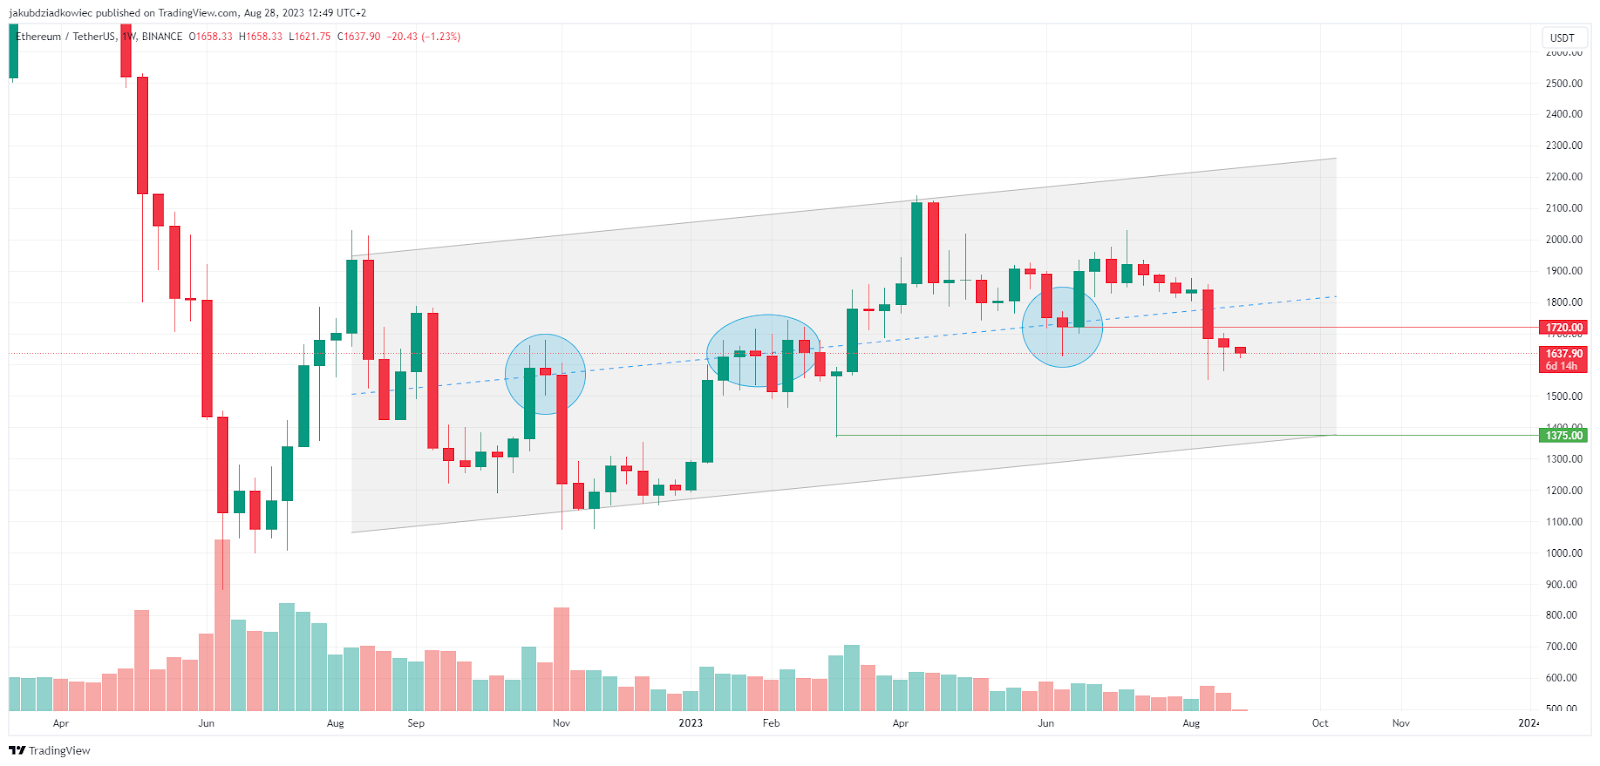
The Ethereum price is holding above the key support level of $1,630. If this support zone continues to hold, we may see a rebound to the $1,800 level. However, readings on the weekly chart support a bearish scenario. Firstly, ETH price has been trading within an ascending parallel channel for over a year. Since then, the middle of this channel has served as both resistance and support multiple times.

However, recent sharp declines in the cryptocurrency market have resulted in the loss of this key support line. The support currently near $1,800 could act as resistance in a potential rebound.
Should You Buy Ethereum (ETH)?
The dip zone at the beginning of March 2023 is at $1,375. If the ETH price fails to make the anticipated rebound, demand could be found in this zone. The fact that the last two weeks’ closing was below the $1,720 level favors the bears. This level was a higher low in June 2023 and coincided with the channel median.
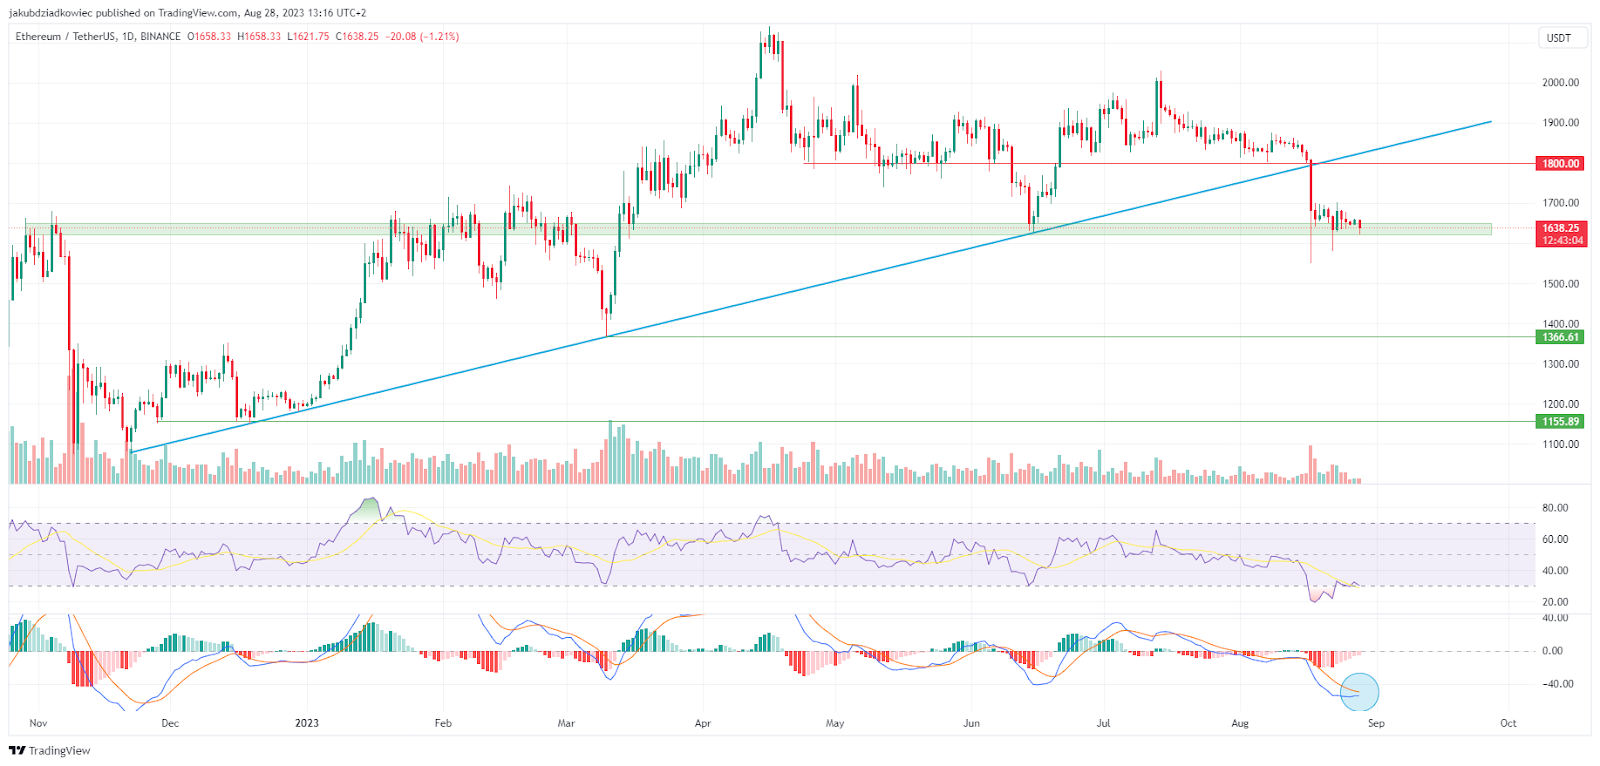
The daily chart confirms most of the readings on the weekly timeframe. However, there are some details that could give hope to ETH investors. Firstly, the loss of an important diagonal support line that has been in place since November 2022 can also be seen here. ETH price confirmed this line four times before finally breaking it on August 17th. Breakouts from such long-term structures often indicate a reversal in trend. Here, downward movement suggests the beginning of a downtrend. However, unlike the weekly chart, the daily chart requires confirmation as long as ETH price holds the $1,630 support.

The RSI has already exited the oversold zone (below 30) and continues to rise despite the continuous decline in price. This upward trend indicates the potential for a short-term upward movement. The MACD will give a bullish signal by forming its first green momentum bar since August 15th. This suggests a possible test of the $1,800 level in the near future.
Investors hope for a scenario where the $1,630 support holds and BTC price does not experience overselling. If the support is lost, the $1,370 and $1,155 lows may be tested.

 Türkçe
 Español


