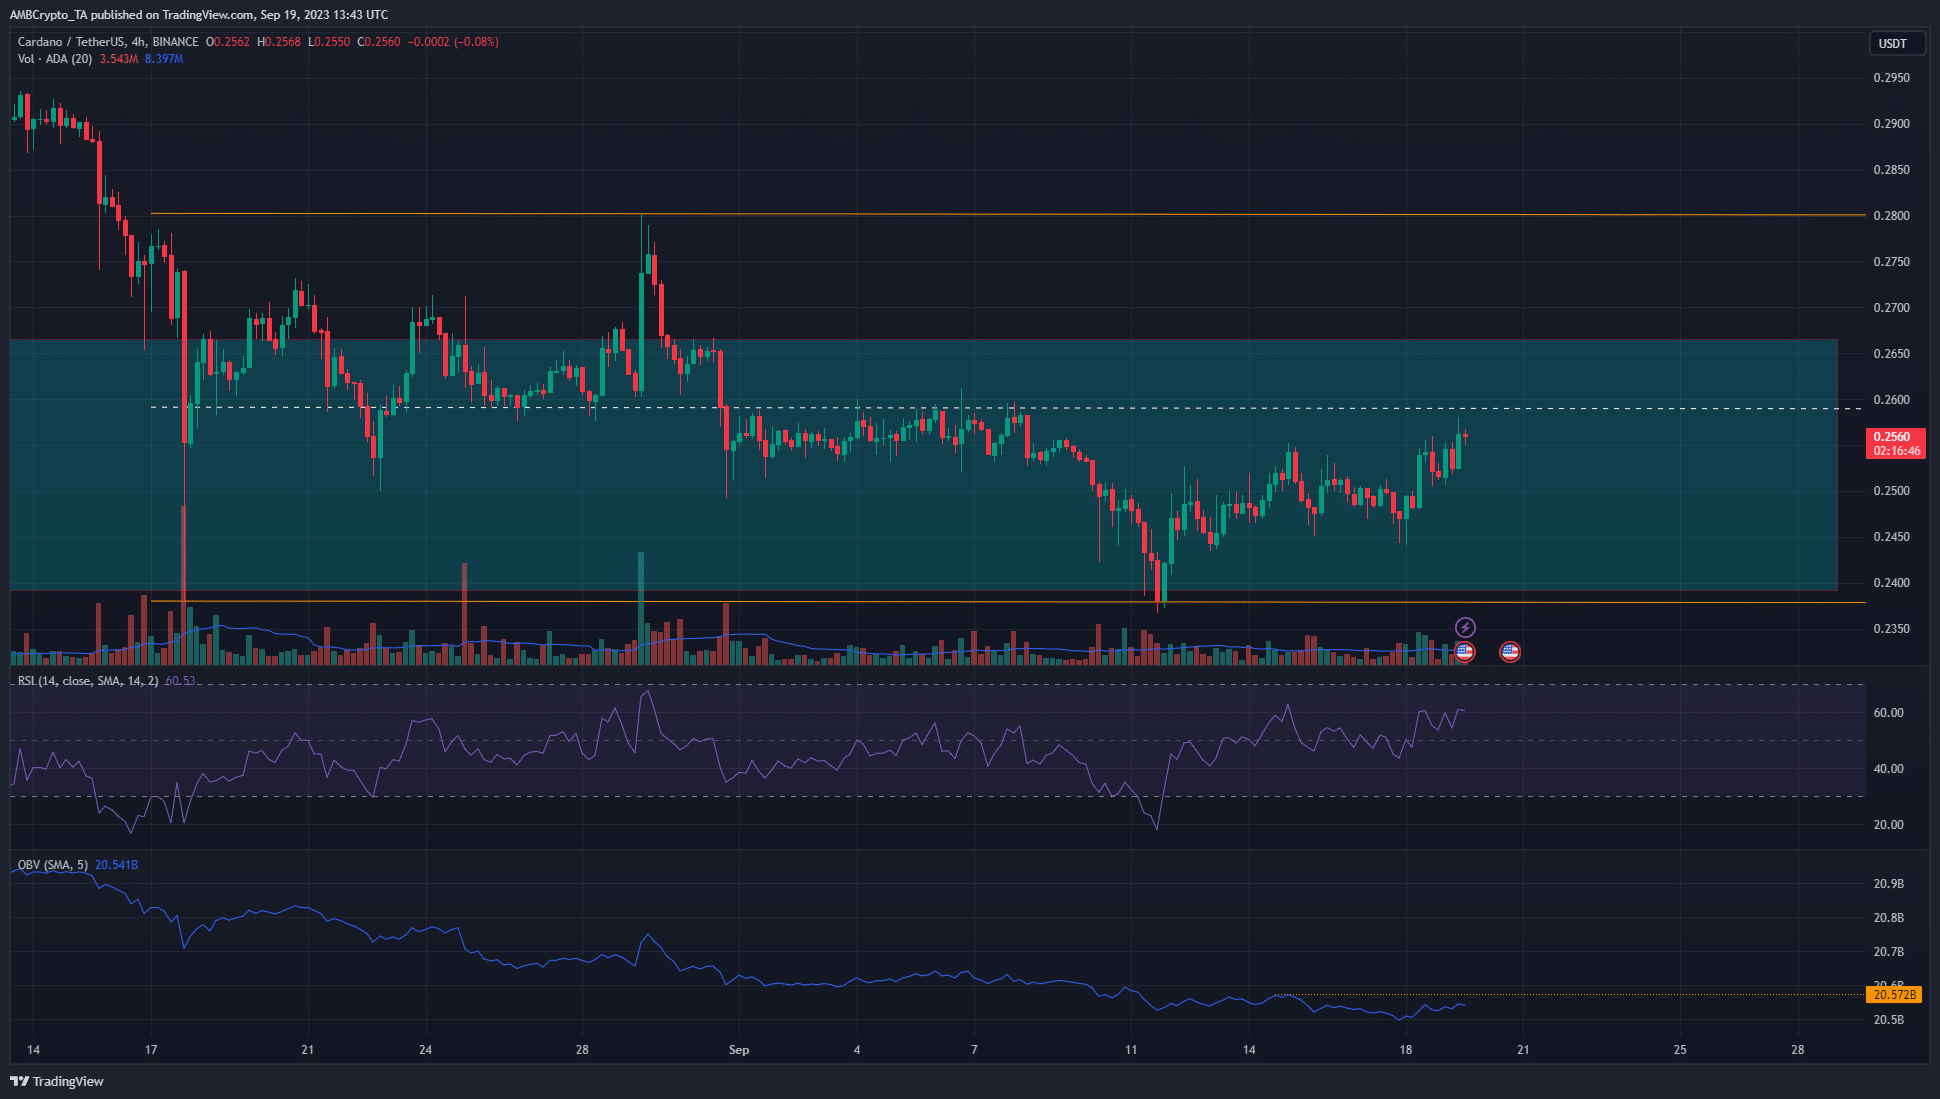
Cardano (ADA) experienced a jump from $0.238 level. However, there is no upward trend on the daily or four-hour chart. It is stated that the recent uptrend may end with the price reaching a resistance level in the popular altcoin. However, there is still some buying pressure.
Critical Weekly Report for ADA!
The weekly development report of Input Output Global showed that the team continues to work on improving the network. This could be a situation that long-term holders will be encouraged to take action. However, it is likely to have very little impact on prices in the short term. From August 17th to August 29th, ADA saw a jump from $0.238 to $0.28. These levels indicate the extremes of a range that ADA has been trading for about a month.
The midpoint of this range is $0.259. Additionally, the level served as support at the end of August but turned into resistance at the beginning of September. At the time of writing, ADA was once again close to the mid-level resistance. While the Relative Strength Index (RSI) has shown strong upward momentum in recent days, the On-Balance Volume (OBV) did not reflect strong buying pressure. Breaking the local resistance in OBV may be required for the indicator to indicate an upward intention.

ADA Price Future!
According to experts, the market structure was bullish on the four-hour chart. However, the $0.259-$0.26 range represents a short-term downward trend. There was a high probability that ADA bulls would be rejected after a move to this range. On September 18, Cardano rose from $0.245 to $0.255, an increase of 4.3%. Open Interest also steadily increased towards the upside. When bulls faced trouble at $0.255 and the price dropped to $0.251, open interest declined further.
This situation may indicate significant profit-taking activities by market participants and their belief that ADA cannot break the local resistance above $0.255. Additionally, spot CVD increased in the Cardano spot market in the past 24 hours, indicating demand.

 Türkçe
 Español


