As notable developments in the crypto market come to the forefront, recent declines have caused fear and concern among investors. Bitcoin prices appear more inclined to fall further during this period. However, market fundamentals indicate something different. Bitcoin dropped about 10% last week and continues to struggle to stay above $58,000.
Bitcoin Chart Analysis
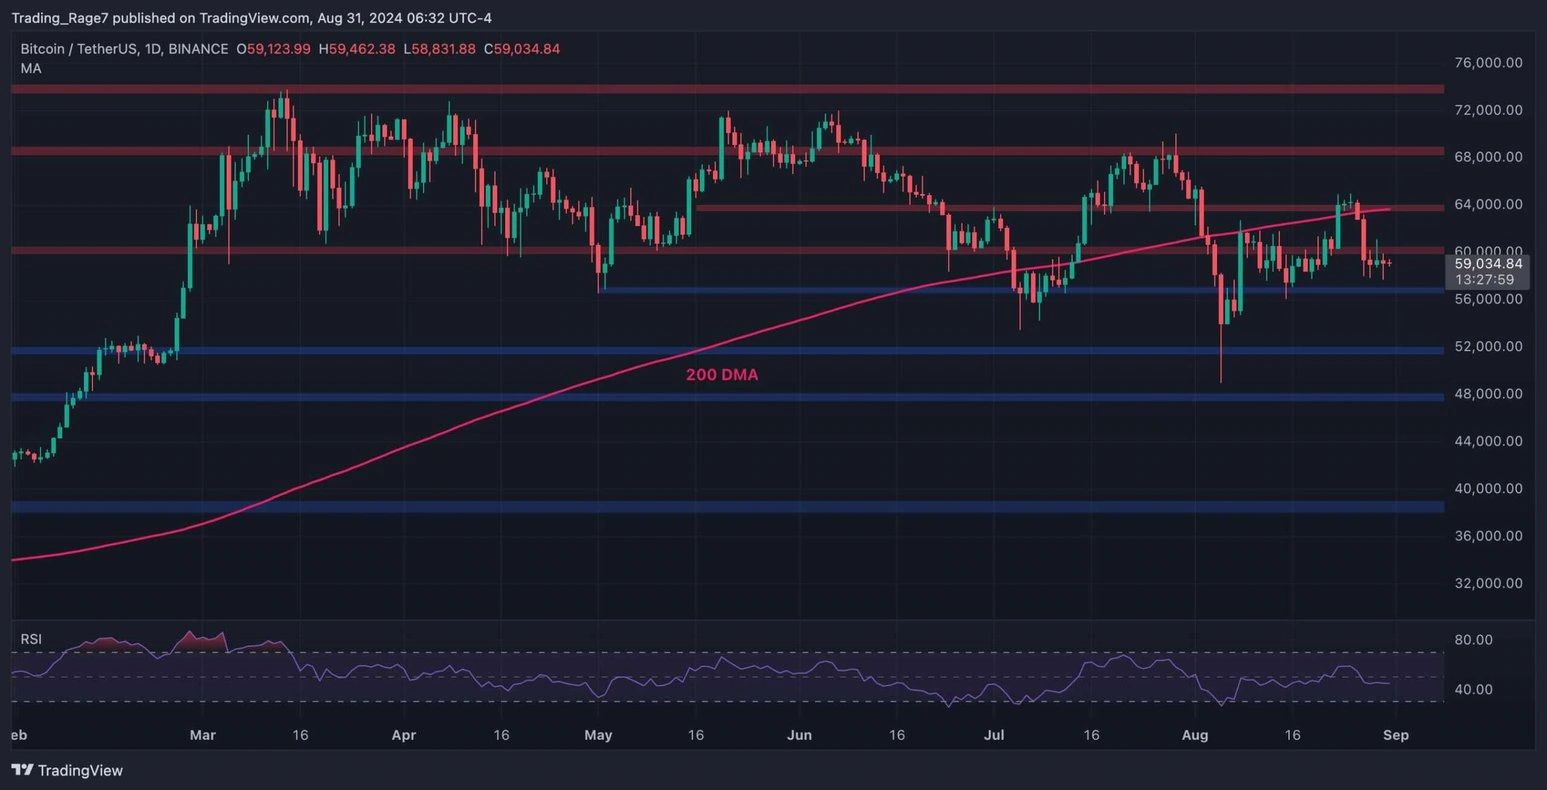
On the daily chart, Bitcoin is consolidating at the $60,000 level after a rejection from the $64,000 resistance line and the significant 200-day moving average around the same price mark. The market is currently likely to test the $56,000 support level.
The RSI indicator has also fallen below the 50% level, indicating a slight decline in momentum. Therefore, if the $56,000 level cannot hold the price, further declines towards the $52,000 support zone can be expected.

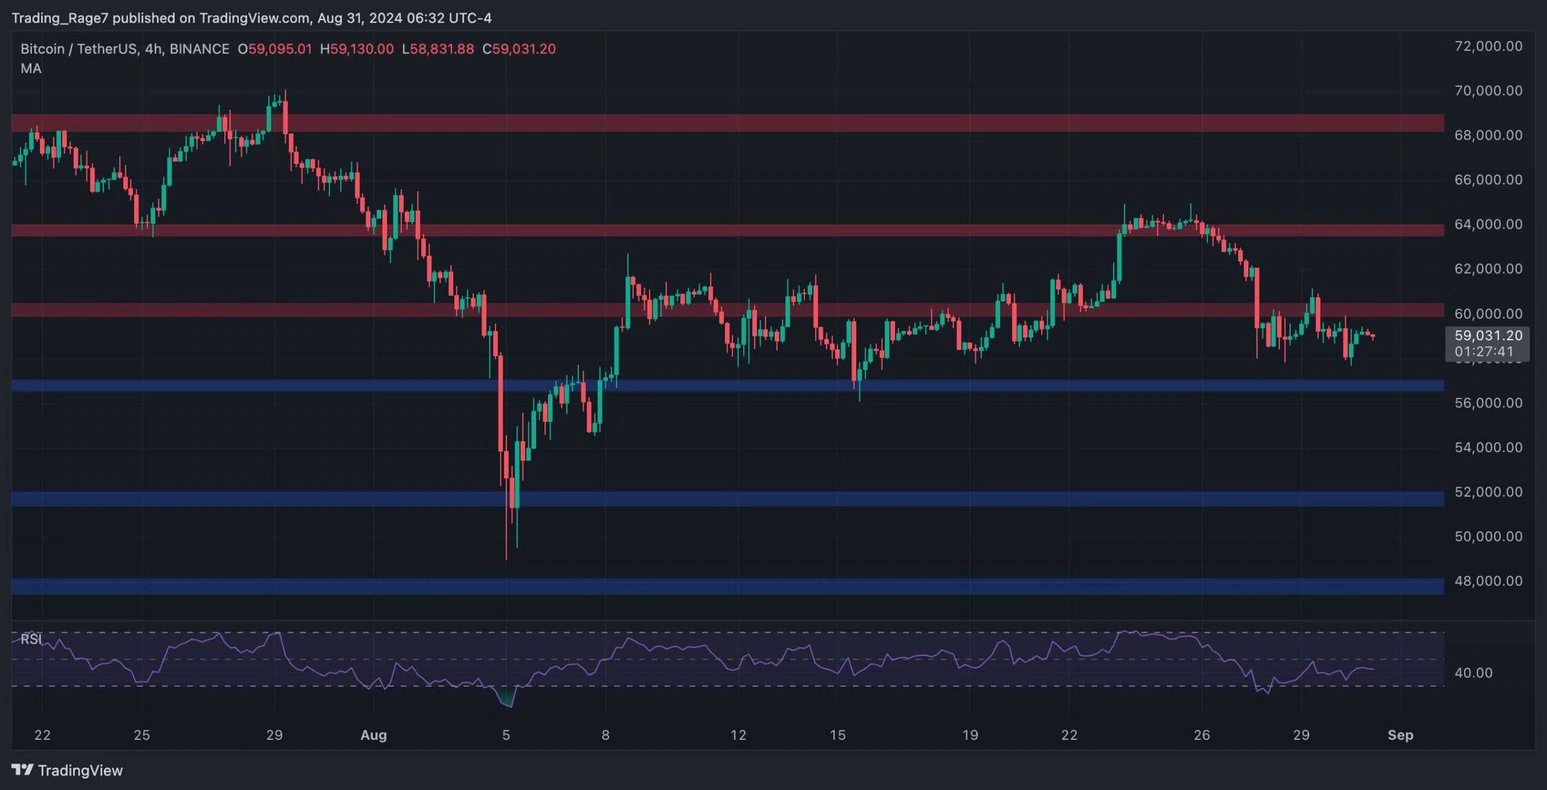
Looking at the 4-hour chart, it is clear that the market could not return to the initial $68,000 resistance level because the $64,000 resistance zone rejected the price downward. Given the current situation, retesting the $56,000 level seems quite likely. Nevertheless, the cryptocurrency might recover from this level as the market structure shows signs of weakness in the downtrend.

Notable Data
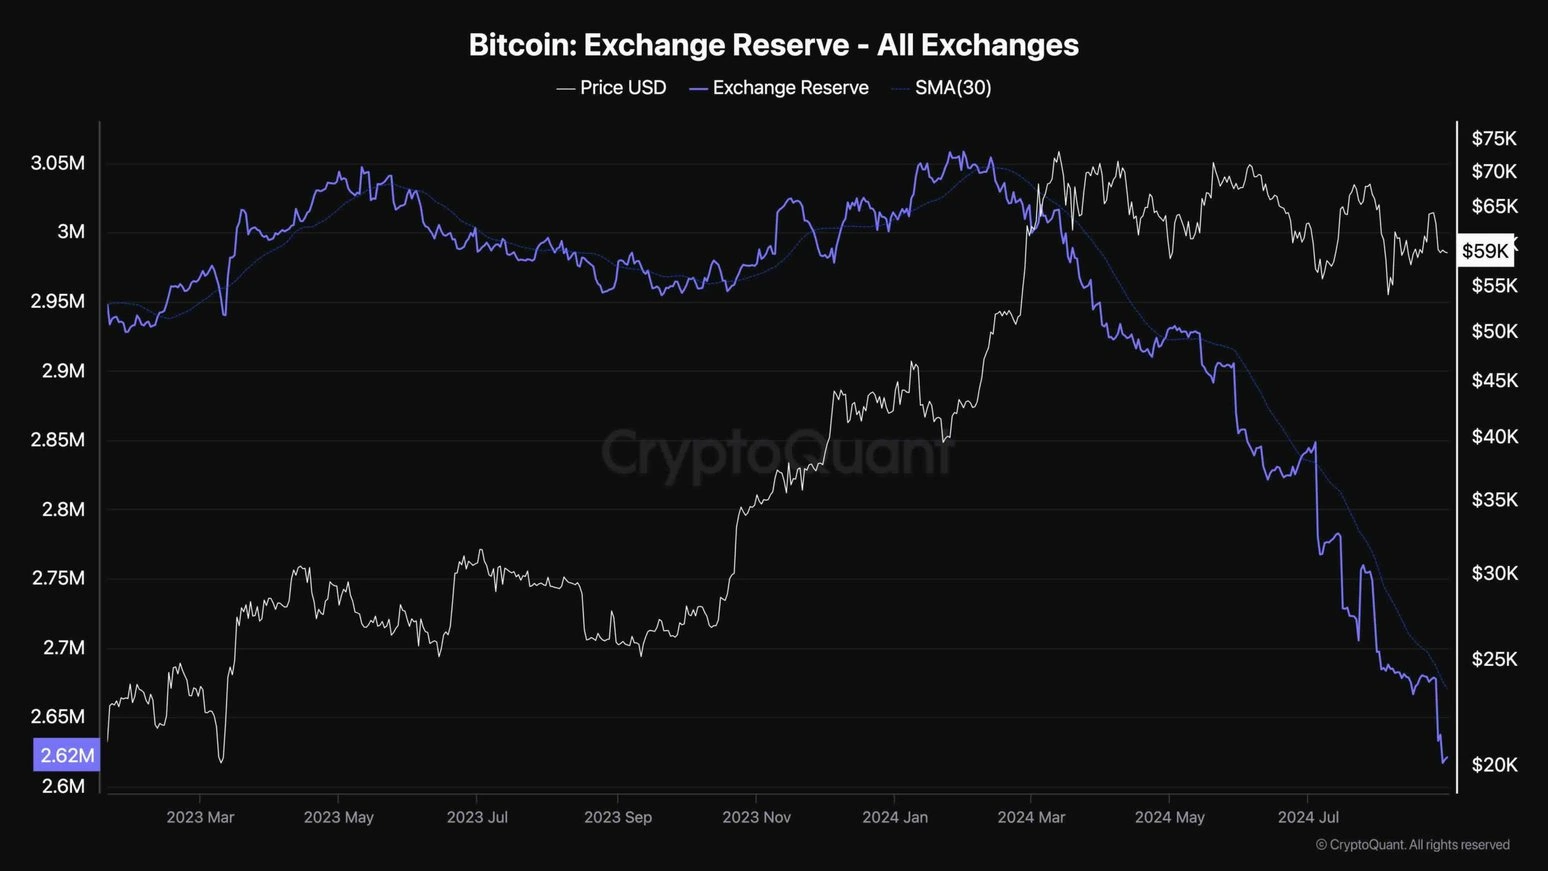
Bitcoin’s price has been going through a long consolidation period in recent months, leading investors to wonder whether the market is in an accumulation or distribution phase. This chart shows the Bitcoin Exchange Reserve metric, which measures the amount of Bitcoin held in exchange wallets. These assets are assumed to represent supply as they can be sold quickly.
As indicated in the chart, the rapid decline in the Exchange Reserve data since the beginning of the consolidation suggests an accumulation phase. As Bitcoin reserves continue to decrease significantly, the likelihood of a supply squeeze leading to a new price rally increases substantially. However, futures market conditions also play a major role in price movement and should be carefully considered before drawing any conclusions.


 Türkçe
 Español


