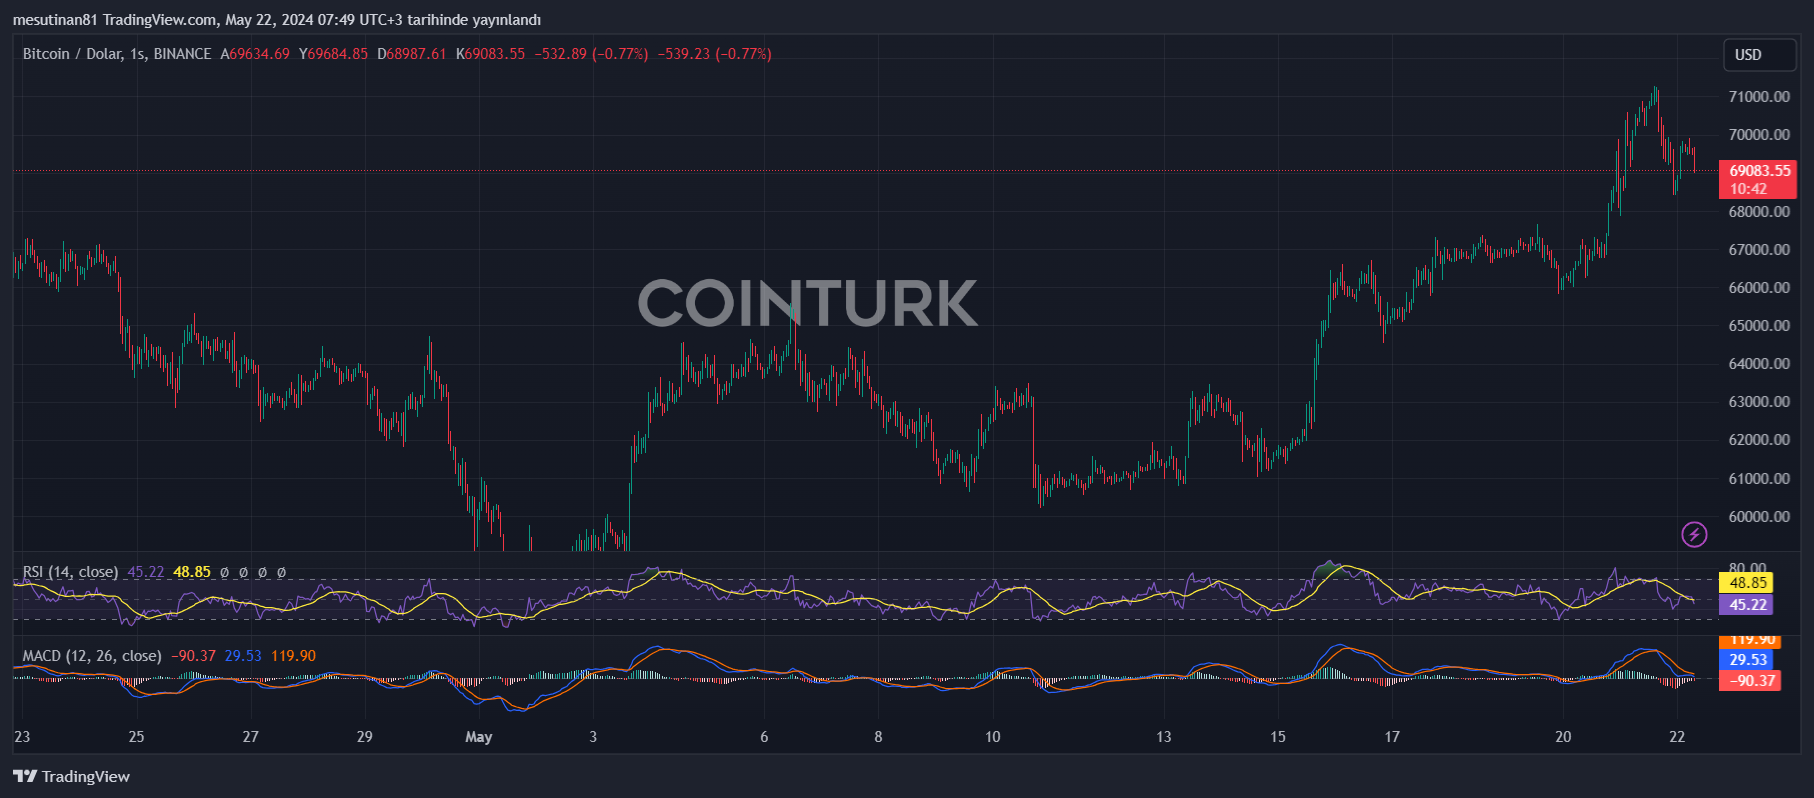
Bitcoin, 72,000 dollars initiated a downward correction. However, it is consolidating around 69,000 dollars, signaling a potential upward movement in the near term. What does this fluctuation mean for BTC, and what should investors expect?
Bitcoin Drops Below 70,000 Dollars
Recently, Bitcoin struggled to surpass the 71,800 dollars resistance zone. However, the price is still trading above 69,000 dollars and the 100-hour simple moving average. This can be considered a positive sign. The hourly chart of the BTC/USD pair shows a significant uptrend line forming with support near 69,200 dollars. This trend line indicates that Bitcoin could start another increase as long as it doesn’t fall below the 68,800 dollars level.
Currently, Bitcoin is facing resistance near the 69,500 dollars level. The first major resistance is at 70,200 dollars. If it can surpass this level, the next key resistance stands at 71,850 dollars. A clear move above 71,850 dollars could push the price higher. In this case, Bitcoin is expected to test the 72,500 dollars resistance.
If Bitcoin’s price rises further, a move towards the 73,200 dollars resistance zone could be observed. Surpassing this level could direct BTC towards the 74,500 dollars resistance. Monitoring these resistance levels is crucial for investors in terms of potential gains.
Key Levels to Watch in Bitcoin’s Declines
Failing to break above the 71,200 dollars resistance zone raises the possibility of a downward trend for BTC. How supported are these declines, and what could shape Bitcoin’s future?
Firstly, technical analysis shows that Bitcoin found an immediate support point at the 69,000 dollars level. This level is also close to the trend line. The first major support at this point is 68,800 dollars. However, the main support zone is currently at 68,500 dollars.

If Bitcoin fails to hold these levels, it is likely to experience further losses. In such a scenario, the price is expected to pull back towards the 67,300 dollars support zone in the near term.
Looking at technical indicators, the hourly MACD is currently losing momentum in the bullish zone. This could indicate a weakening of the upward momentum in the short term. Additionally, the hourly RSI (Relative Strength Index) for BTC/USD is above the 50 level. This shows that the market is in a neutral state, with no clear upward or downward trend.

 Türkçe
 Español


