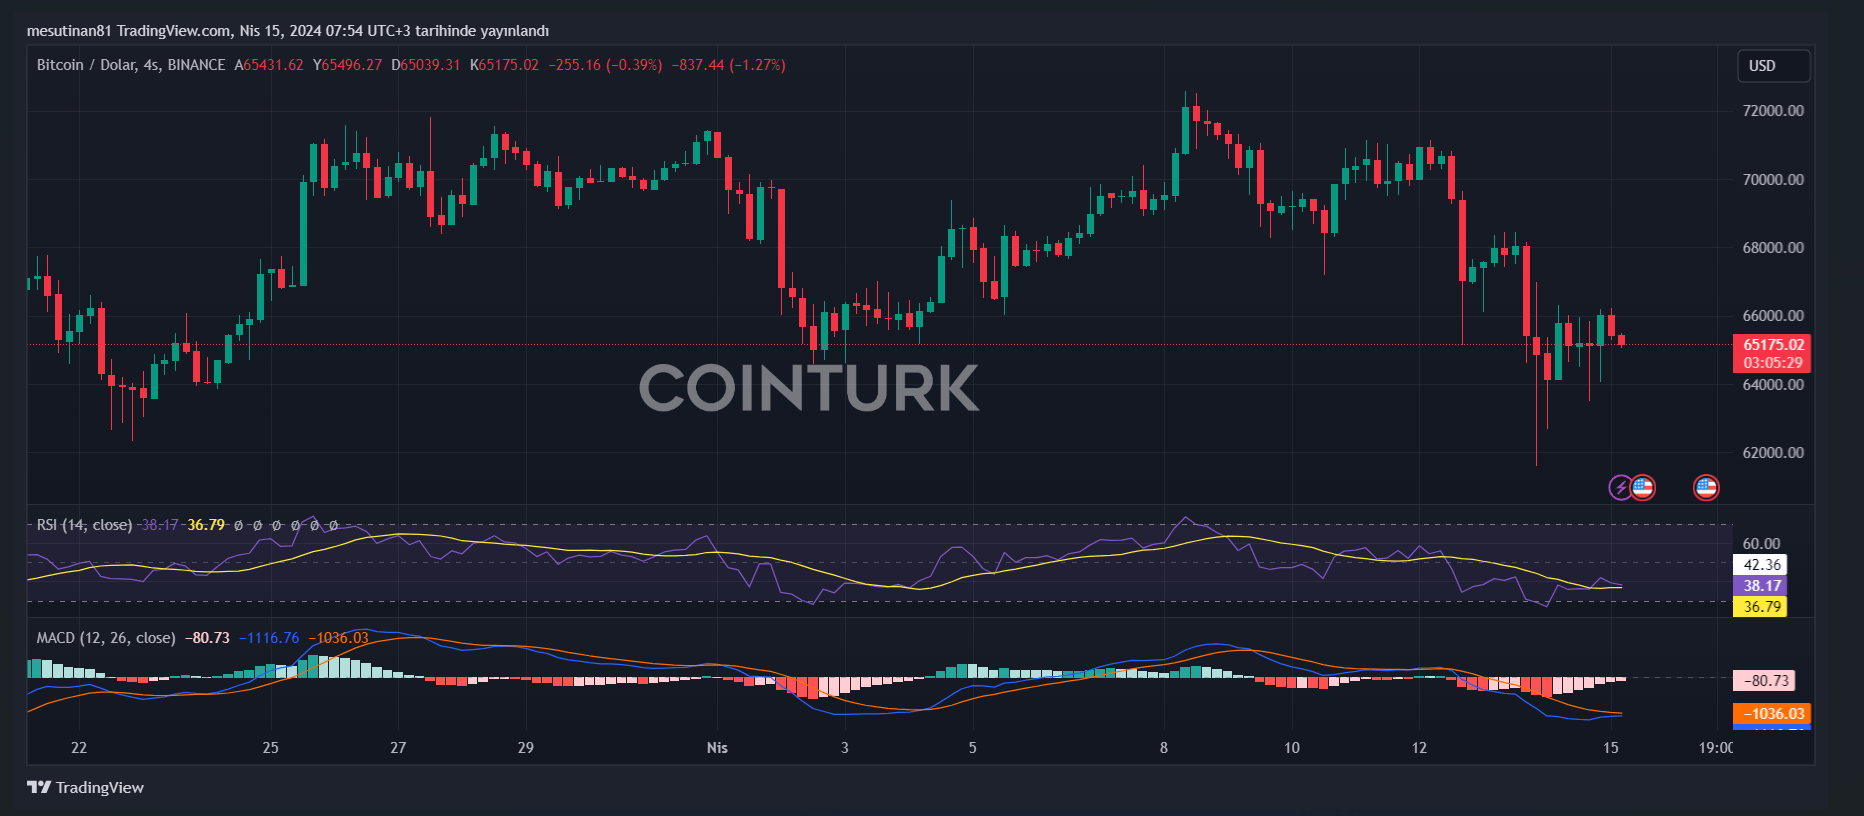
The increasing tension between Israel and Iran has created a profound impact on the cryptocurrency market, particularly affecting the price of Bitcoin. The recent sudden drops in Bitcoin prices are closely associated with the political tensions in this region. Looking at the BTC/USD pair price movements, a recovery wave from the $60,660 level is observed. However, Bitcoin encounters significant resistance levels, facing obstacles in its recovery process.
Bitcoin Price Above $65,000
Currently, Bitcoin is trading above the $65,000 level. According to the 4-hour chart, there is a significant ascending channel formed by the $65,850 resistance. The first major resistance Bitcoin faces is at the $66,000 level. However, if the price can break above this level, a move towards the $68,000 resistance zone could begin.

In this case, it is expected that the price could gain momentum towards the $70,000 levels. The main resistance point is located near the $71,200 region. If Bitcoin can overcome these resistances, it seems likely that it could embark on a journey towards the $72,500 level in the near term.
Caution is advised during this Bitcoin recovery phase. Political factors such as the Israel-Iran tension and uncertainties in the market could cause the price to fall again.
Is Another Drop Possible for BTC?
If Bitcoin cannot break above the $66,850 resistance zone, it could initiate a new downward trend. So, what should investors expect? The BTC/USD pair has captured a significant upward momentum after a sharp decline but has failed to surpass the critical $66,850 resistance zone. This creates uncertainty in the market and increases the risk of a correction movement.
Currently, an important support level for Bitcoin is near $64,500. However, if this support is broken, the price could potentially fall towards the $63,000 level. In this scenario, a $62,000 level could be tested, and even a move towards the $60,500 support area could be observed in the near term.
Looking at the technical indicators, the four-hour MACD is losing momentum and moving away from the bullish zone. However, the four-hour RSI (Relative Strength Index) remains above the 50 level. This indicates that buyers are still somewhat influential in the market.
The main support levels are determined at $64,500 and then $63,000. On the other hand, the resistance levels are being monitored at $65,850, $66,000, and $68,000.

 Türkçe
 Español


