Bitcoin  $63,028 has been oscillating within specific support and resistance levels, displaying a sideways trend recently. The price has not yet established a clear direction, leading to differing opinions among experts regarding its next movement. Current technical indicators suggest that Bitcoin is in a consolidation phase. At the time of publication, Bitcoin is trading below the $100,000 threshold, having lost over 7% in value in the past week.
Key Support and Resistance Levels for Bitcoin
The key question remains whether Bitcoin can rise from the lower boundary of its sideways movement or if a new wave of decline will emerge. Currently, experts are focusing on these two possibilities.
The nearest resistance zone for the largest cryptocurrency lies between $97,521 and $98,430. If the price breaks above this range, the likelihood of upward movement increases. Conversely, failing to break this level could lead to increased selling pressure.
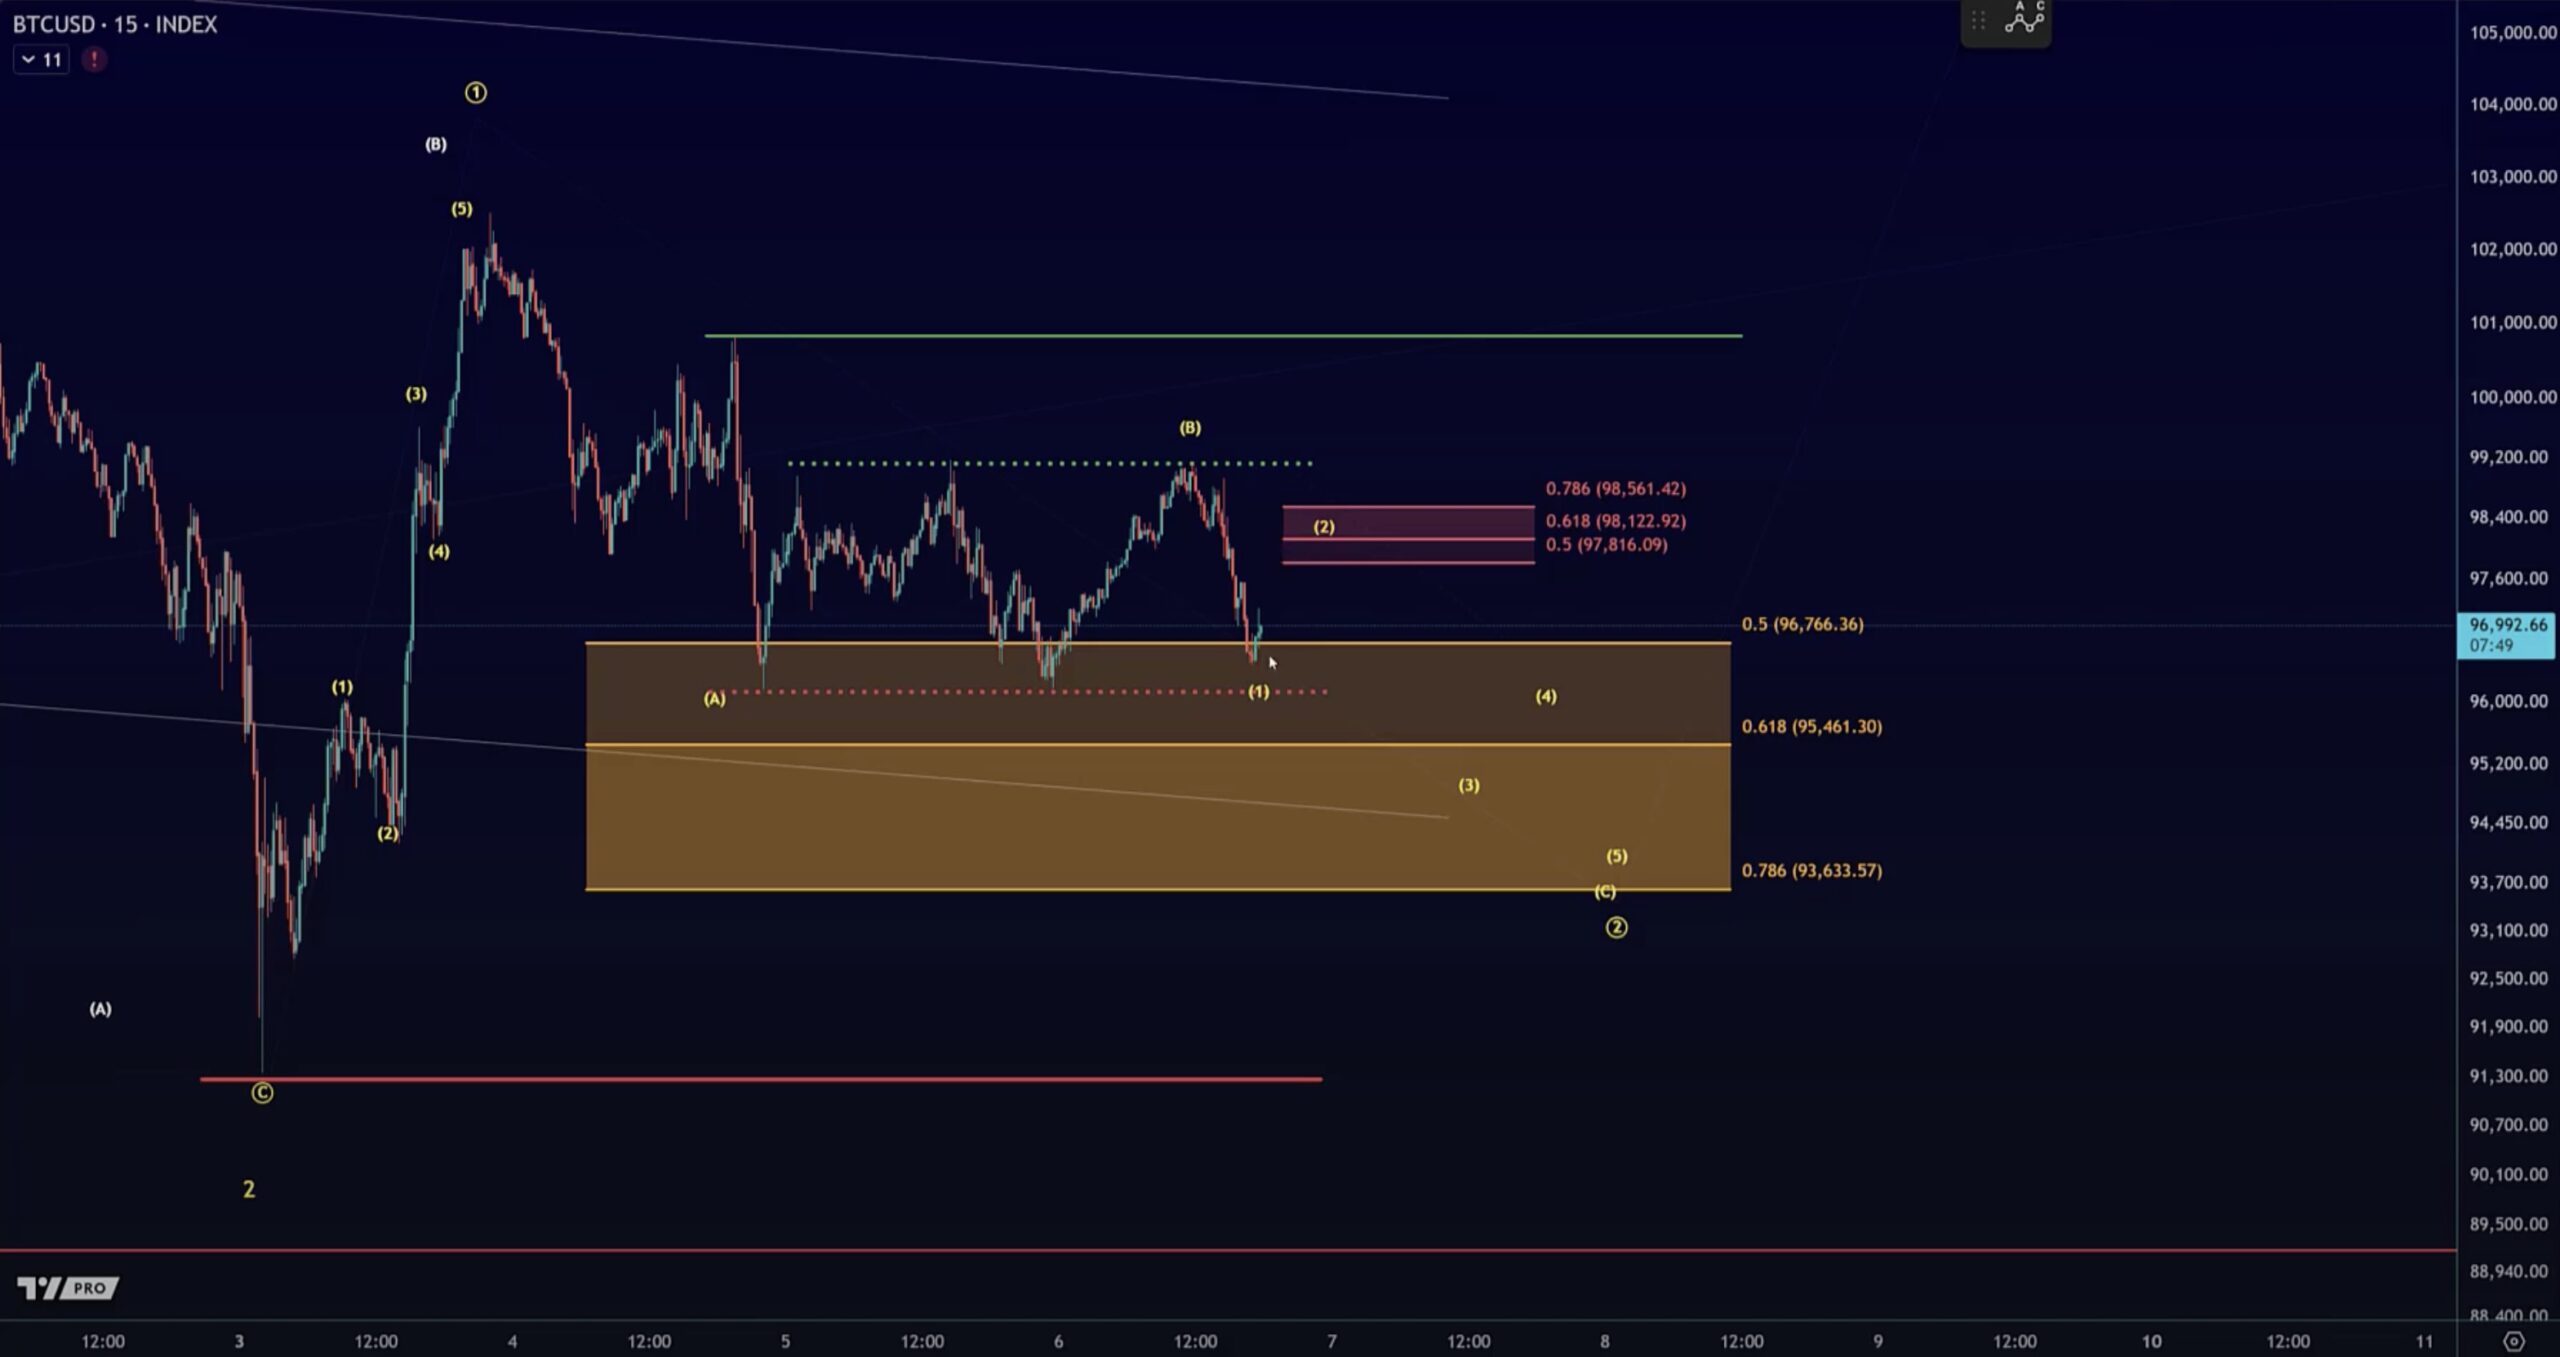
The critical support level to watch below is around $93,633. A sustained closing candle beneath this level could deepen the price decline. Experts indicate that Bitcoin may retreat to the $88,000 to $90,000 range in this scenario.
What Does the Short-Term Outlook for BTC Indicate?
The short-term outlook for Bitcoin appears to signal a mild bear market. The recent price drop suggests that the market is in a corrective wave. Experts are cautioning about the potential for further declines during this correction process.
Popular analyst Capo stated on X that, “If we see a pullback of 5-10%, don’t worry; this could just be part of creating a higher low.” However, he later noted that the $88,000 to $90,000 range could be a potential target area.
According to the analyst, the long-term technical outlook still supports a bull market. While the current correction may be part of a larger upward movement, sideways trading or further testing of lower levels seems likely in the short term.