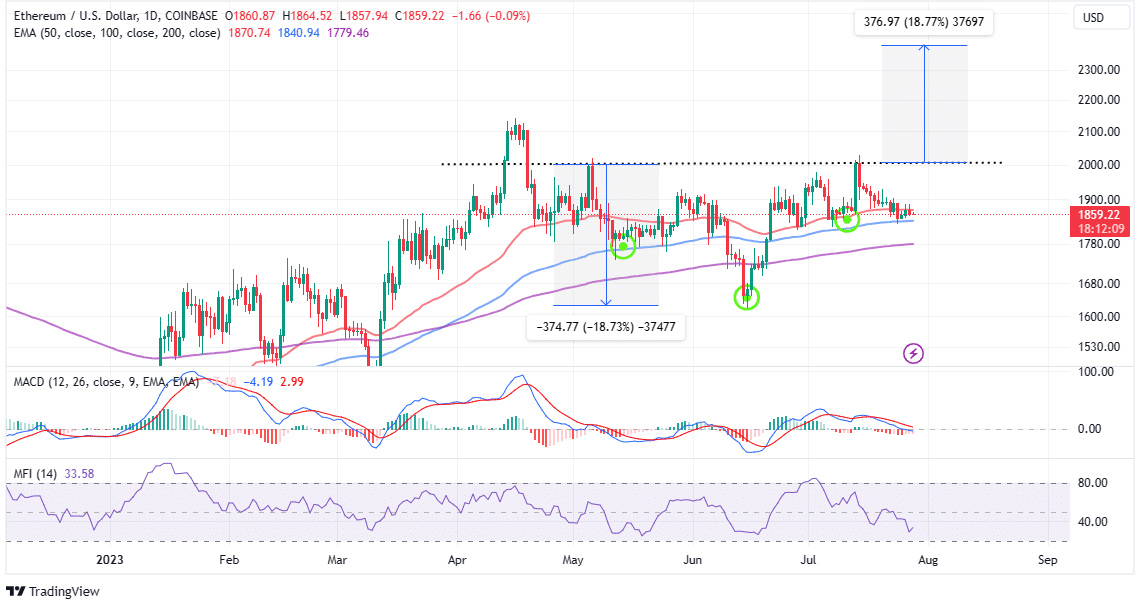
Ethereum (ETH) has remained above $1800 for about two months and is currently trading at $1867 at the time of writing this article. Despite the overall decrease in trading volume, the upward movement has been limited to below $2000. This is a result of investors turning to other leading altcoins such as XRP, Cardano (ADA), Polygon (MATIC), Solana (SOL), and finally Dogecoin (DOGE) after the partial ruling in favor of Ripple by the court in the case opened by the U.S. Securities and Exchange Commission (SEC). Currently, the only condition for Ethereum to rise is to maintain a price above $1800, which could lead to an increase to $2385.
What Does Ethereum Need to Rise?
The Ethereum price is in the midst of potentially a major breakout that could not only push it above $2000 but also allow bulls to fill the gap up to $2400 for the first time since May 2022. The daily price chart shows the formation of a reverse head and shoulders (H&S) pattern, with a target price level of $2385 according to this formation.
H&S is an important bullish formation that indicates the end of the downtrend and the beginning of an uptrend. The formation has three troughs; the middle lowest point is the head, and the ones on the left and right, which are higher than the head, are the shoulders. For the H&S on the Ethereum chart to work, the price needs to break above the line connecting the shoulders, which is located around $2000.

When trading based on H&S, it may be appropriate to look at other indicators, especially the Money Flow Index (MFI), which tracks the flow of funds into and out of the Ethereum market. The daily price chart’s MFI has a bullish outlook, indicating that a breakout is imminent in this H&S pattern.
Evaluating the Potential Rise of ETH
On the other hand, the Moving Average Convergence Divergence (MACD) indicator, which adds reliability to the bullish outlook on the daily price chart, is expected to give a buying signal over the weekend. Investors who want to enter a long position in ETH can expect the bullish crossover in the momentum indicator, marked by the blue MACD line crossing below the red signal line.
To be on the safe side, the ETH price needs to surpass and stay above the 50-day Exponential Moving Average (EMA) at $1870. The first profit-taking level for investors who buy based on the MACD bullish signal could be the $2000 level, but if the H&S formation works, there is a potential for the price to reach $2385 with the momentum gained.


