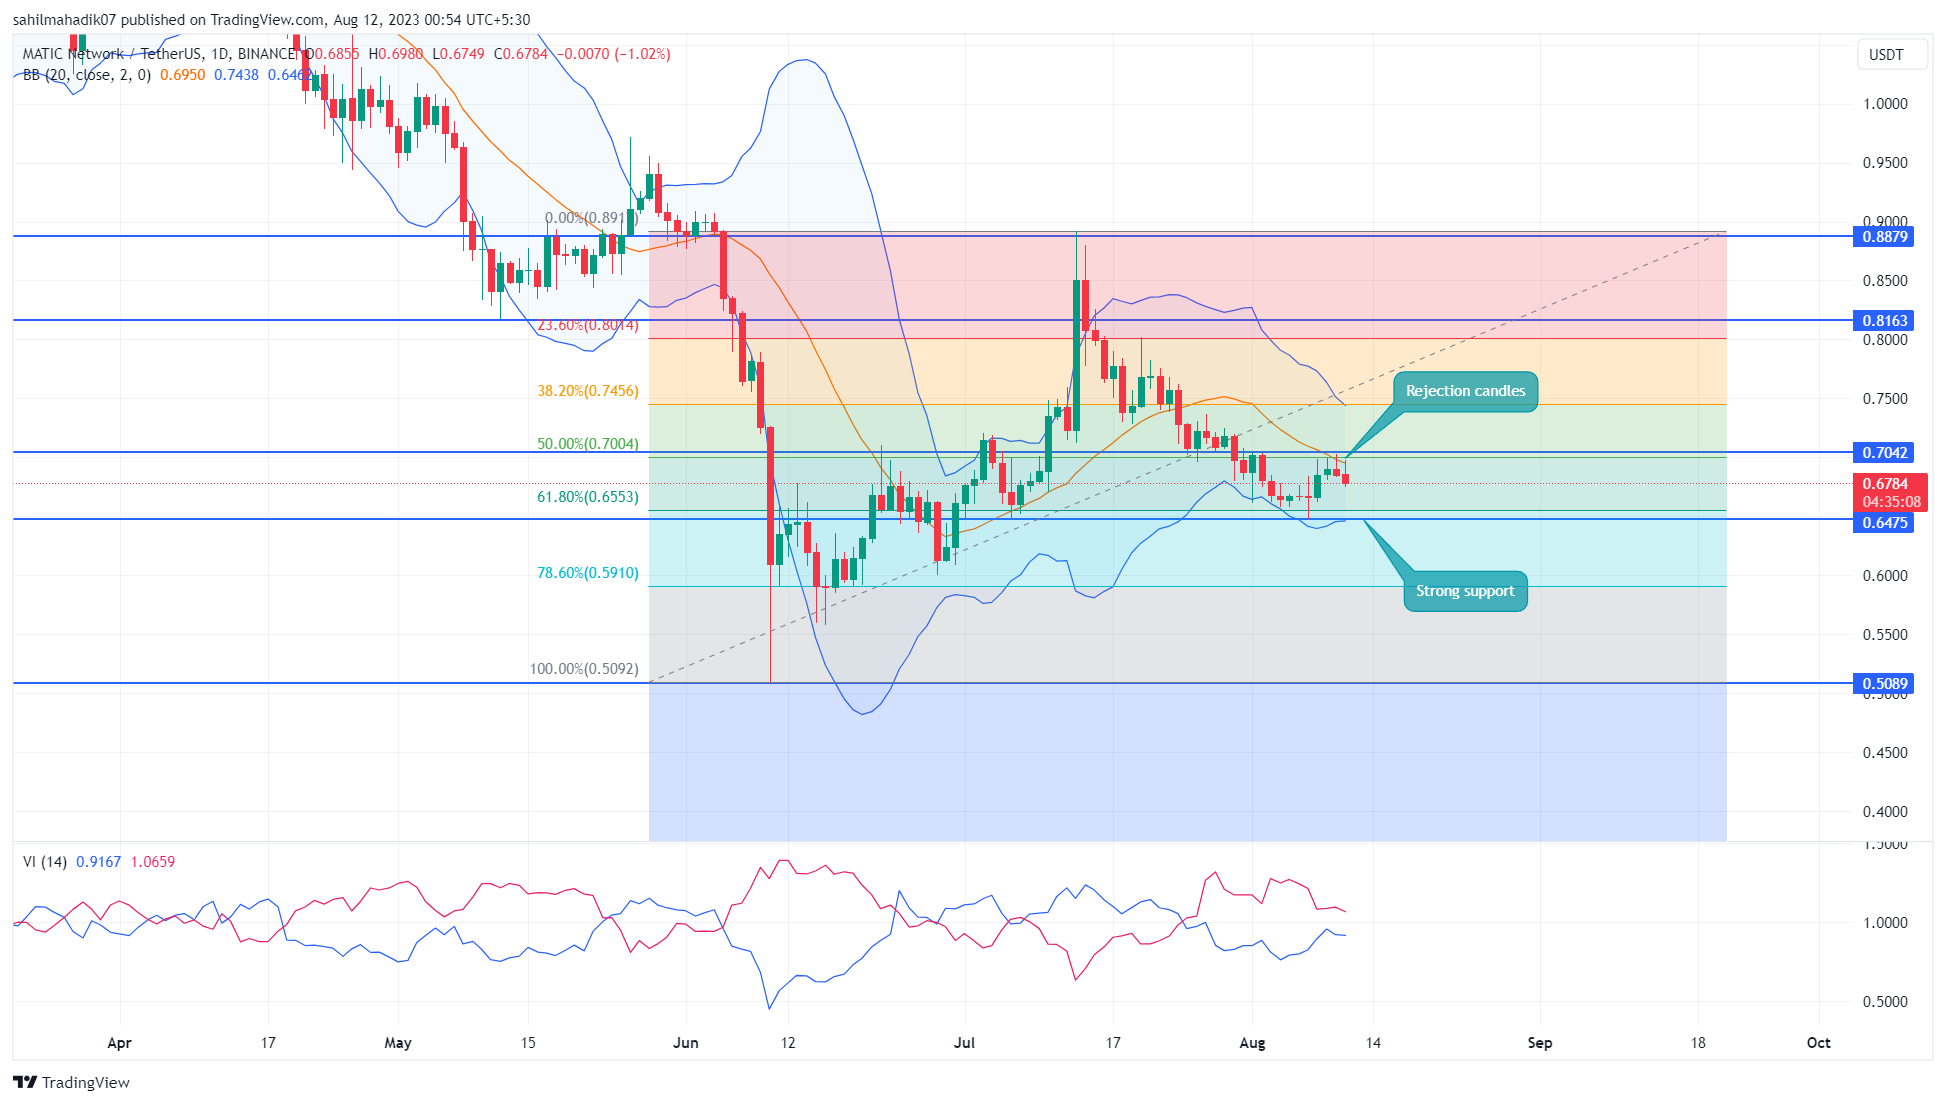
Polygon (MATIC) daily price chart clearly shows a reverse V-shaped drop from $0.89. Such a drop indicates a strong selling pressure with significant declines expected in a short period. Indeed, the price of MATIC has reached the support level of $0.64 with a 27% drop in the last month, which is a result of this strong selling pressure. Will the decline in the price of this popular altcoin continue? Let’s take a closer look.
Polygon Price Analysis
The price of MATIC in a downtrend has found support at $0.6475, which is the same level as the 61.8% Fibonacci correction level. However, this correction to the low Fib level indicates some weakness in the bullish momentum, so investors need to remain cautious.

Although MATIC recovered from the $0.647 support on August 7th, it failed to surpass the general resistance level of $0.7. The fact that the altcoin has been struggling to break this barrier for the past four days indicates that sellers are piling up at this level.
The failure to surpass the $0.7 resistance level suggests that the downward movement will continue, and the $0.647 support level will be revisited. If the price of MATIC closes below this support level on a daily timeframe, sellers are expected to continue the correction with an additional 7.5% drop and test the psychological support at $0.6.
Can MATIC’s Price Drop to $0.6?
Although the price of MATIC shows sustainability around the $0.647 support, indicating that buyers are actively accumulating at discounted prices, investors need to closely monitor this support level. It is possible for the price to bounce from here and return to an upward trend. Furthermore, if the $0.7 resistance is broken, a rally up to the $0.8 resistance may be seen.
The upward movement in the lower band of the Bollinger Bands indicator on Polygon’s price chart provides additional support for $0.647, while the downward transition between the VI+ (blue) and VI- (orange) slopes of the Vortex Indicator reflects a strong bearish momentum, indicating the need for caution.


Hola