This week, we had more exciting days in terms of the cryptocurrency market compared to previous weeks. Especially Bitcoin breaking the $28,000 resistance level every time raised investors’ hopes, but unfortunately, daily candle closures did not happen above this level. However, Bitcoin, which is currently trading at $27,800, brought some movement to altcoins with this rise.
Solana Chart Analysis
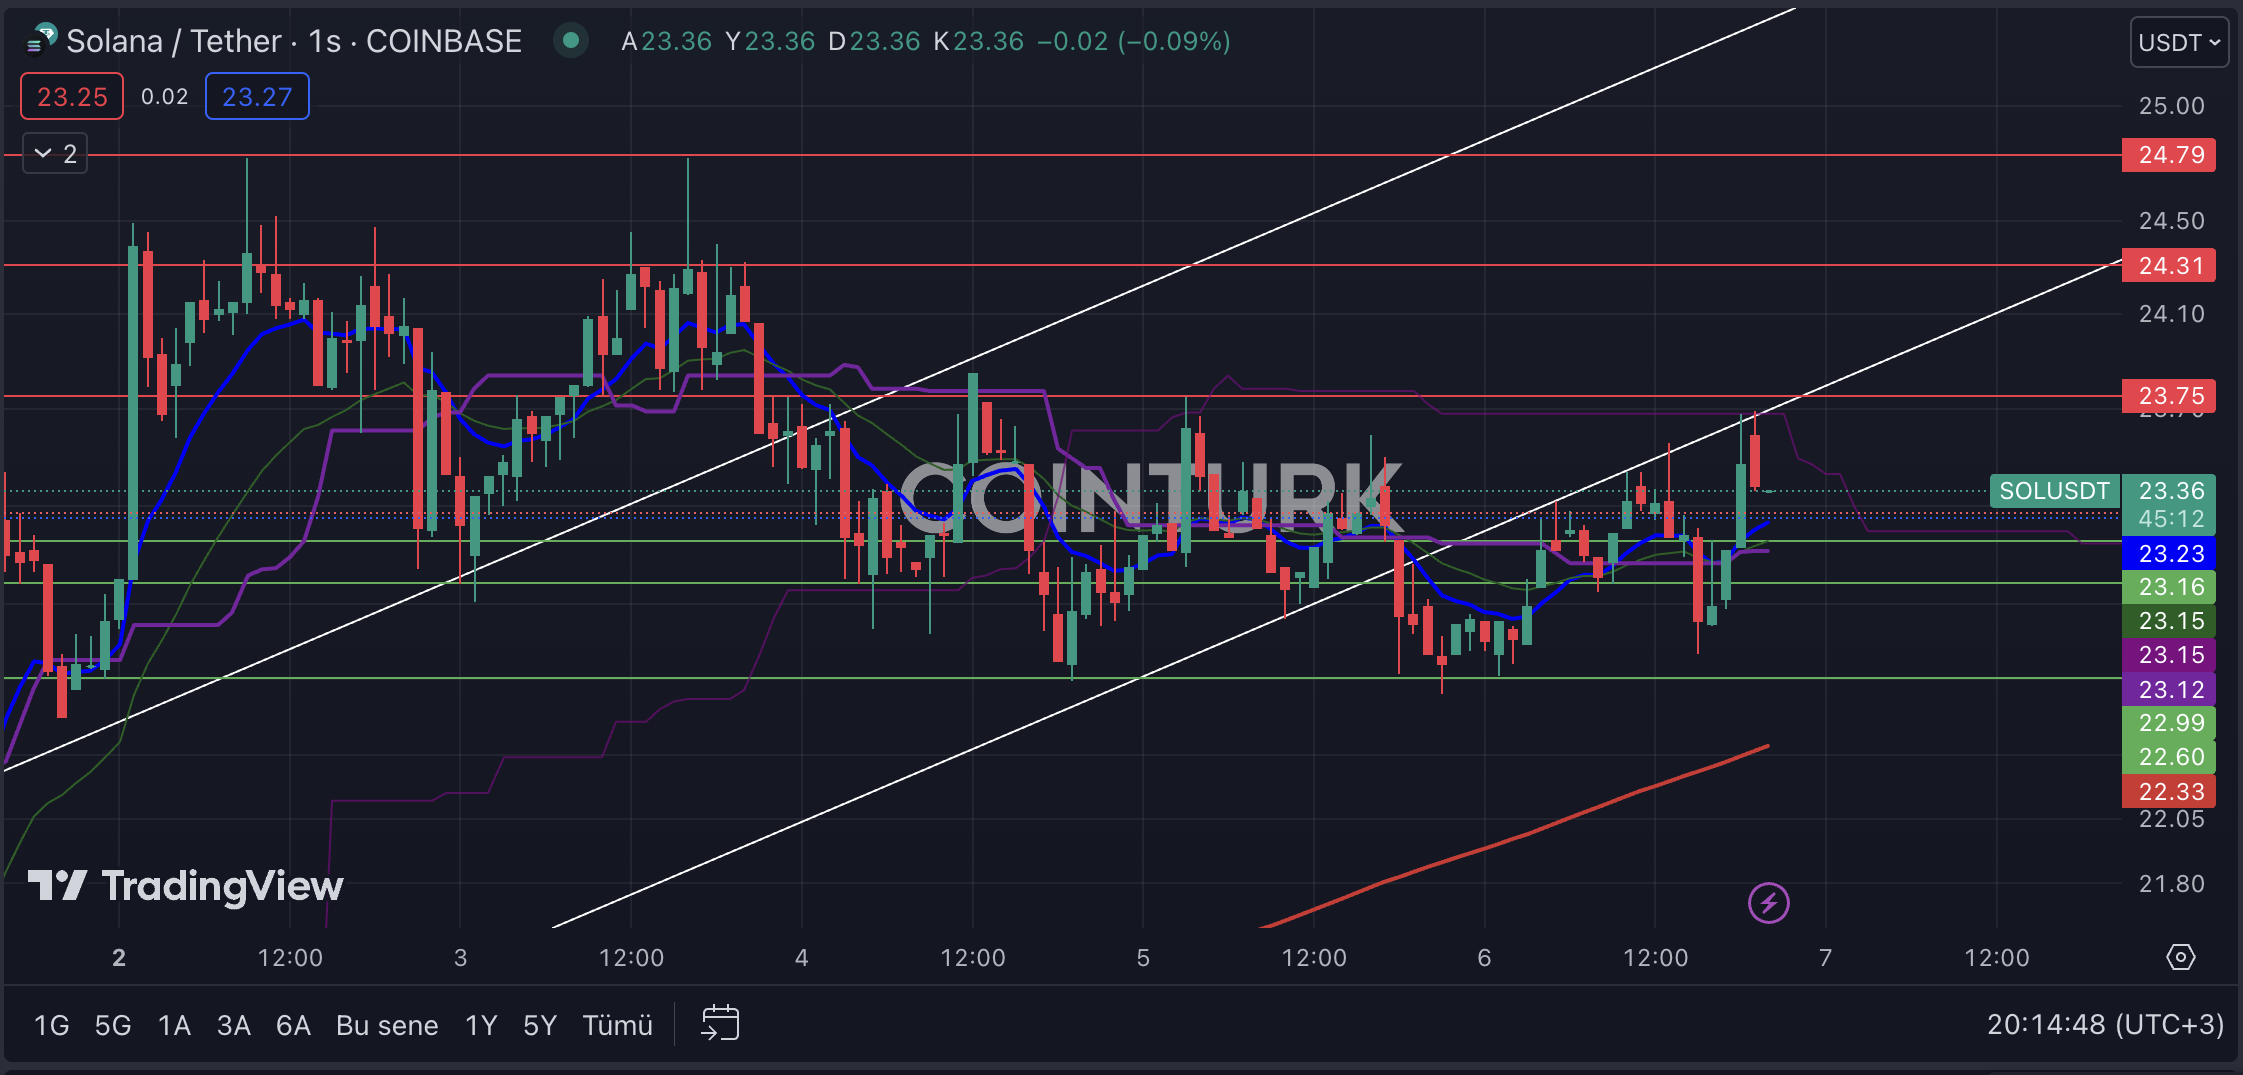
The recent candle closures on the one-hour Solana chart pleased investors, but the fact that the last two candle wicks worked as resistance instead of support in the rising channel formation raised concerns. Recent price movements have allowed futures traders to make significant profits.
The support levels that need to be followed for Solana are respectively $23.16, $22.99, and $22.60. Especially the breakdown of the $22.60 level could cause a significant drop in Solana’s price and result in serious losses. The breakdown of the $22.33 level, which is the EMA 200 average, could lead to a different dimension of decline.
The resistance levels that need to be followed for Solana are respectively $23.75, $24.31, and $24.79. Especially a one-hour close above the $23.75 level will trigger an upward movement by re-entering the formation zone and breaking the resistances.

Chiliz Chart Analysis
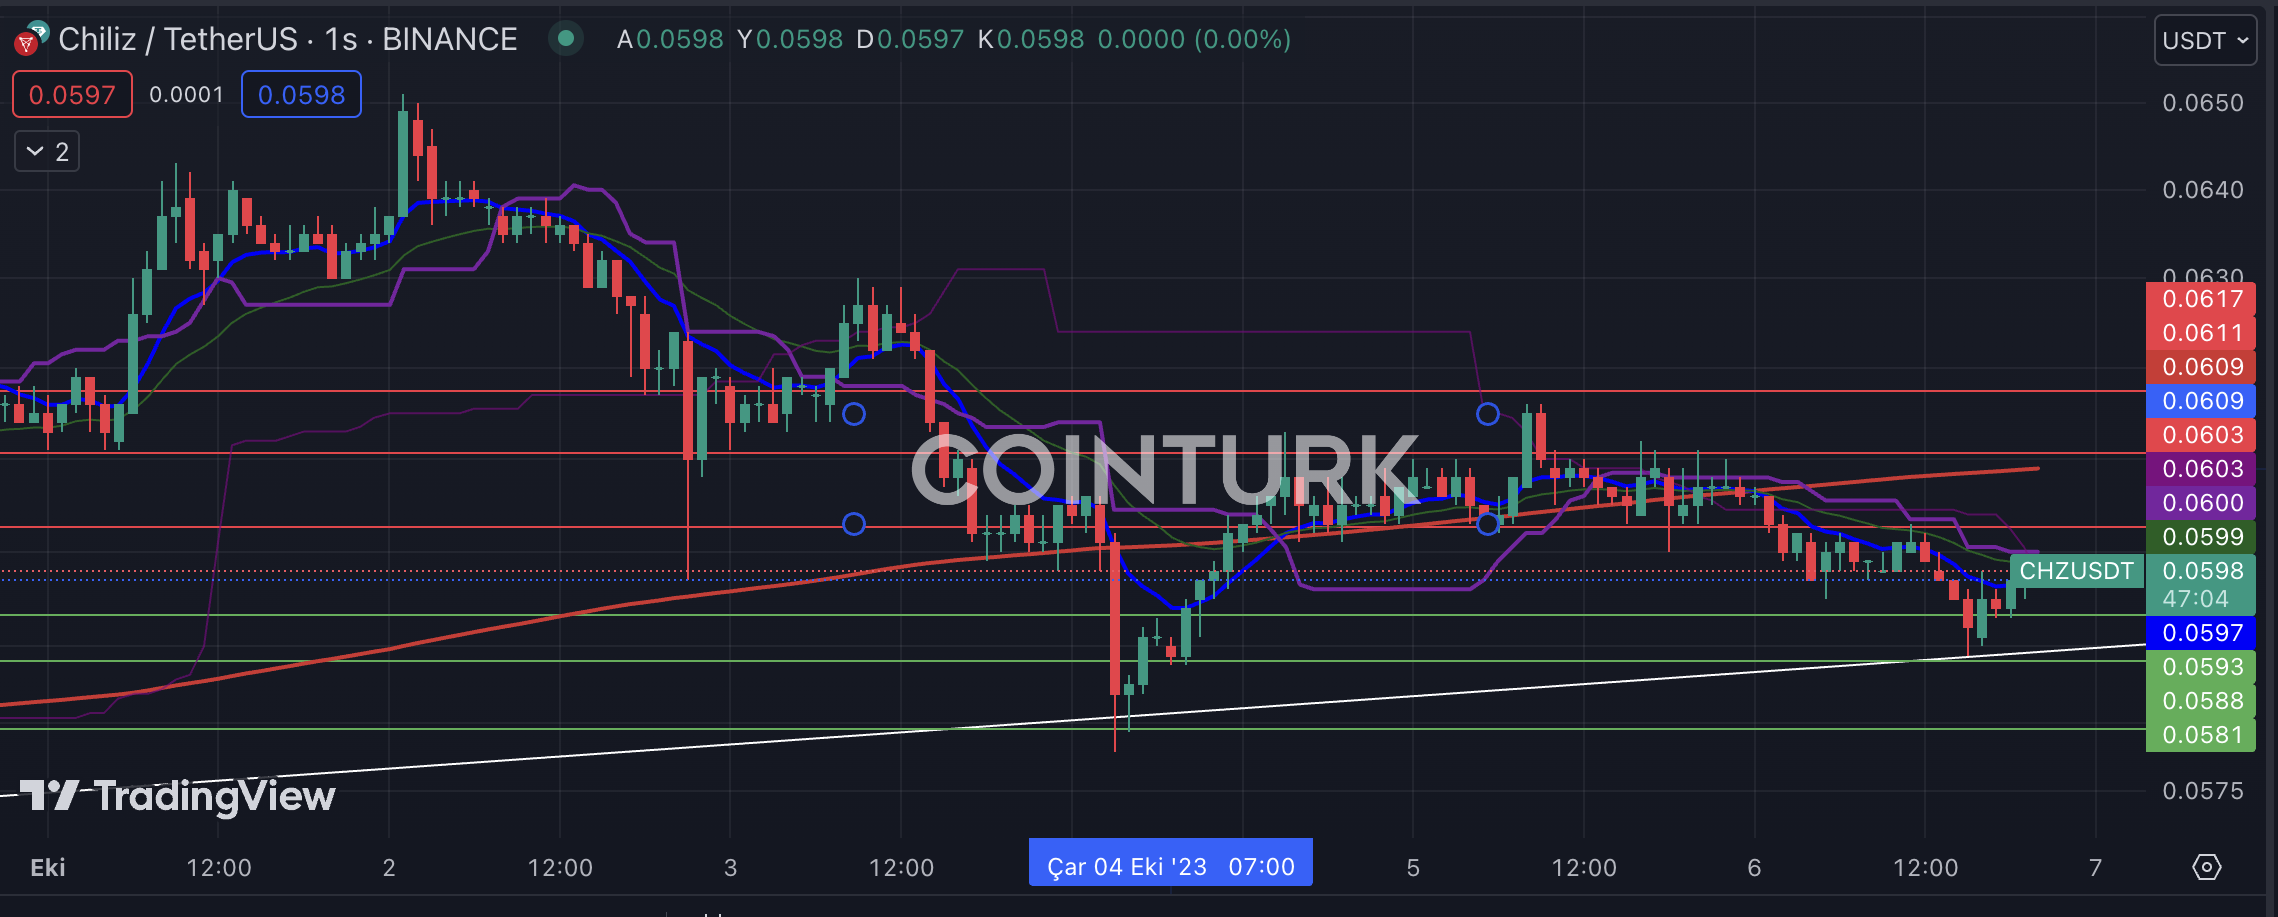
A narrowing structure is evident in the one-hour chart of Chiliz. Things are not going well for Chiliz lately, with a significant loss of value, and it seems to continue to disappoint both its investors and followers if there is no positive flow.
The important support levels that need to be followed for Chiliz are respectively $0.0593, $0.0588, and $0.0581. Especially, a close below the $0.0588 level will accelerate the decline. The breakdown of the $0.0581 level will result in the lowest Chiliz price in recent years and cause many investors to sell at a loss.
The important resistance levels to be considered for Chiliz are respectively $0.0603, $0.0611, and $0.0617. Especially, the breakthrough of the $0.0611 level will break the downtrend and allow the price to rise above the EMA 200 level, which has acted as resistance in the past. This scenario may also lead to a possible mini rally.


 Türkçe
 Español


