
Cryptocurrencies, with Bitcoin at the forefront, have spent the past several months in a downward spiral due to persistent selling pressure and heightened geopolitical tensions. While many investors are bracing for the possibility of even lower price levels, some analysts continue to see signs of upward momentum. Despite Bitcoin’s price dipping below $68,000 as this article was being prepared, analyst Sheldon noted that recent chart patterns indicate a potential bullish reversal. In fact, Bitcoin was forming its second consecutive 15-minute green candlestick at the time of writing, hinting at emerging buying interest.
Momentum builds before key resistance emerges
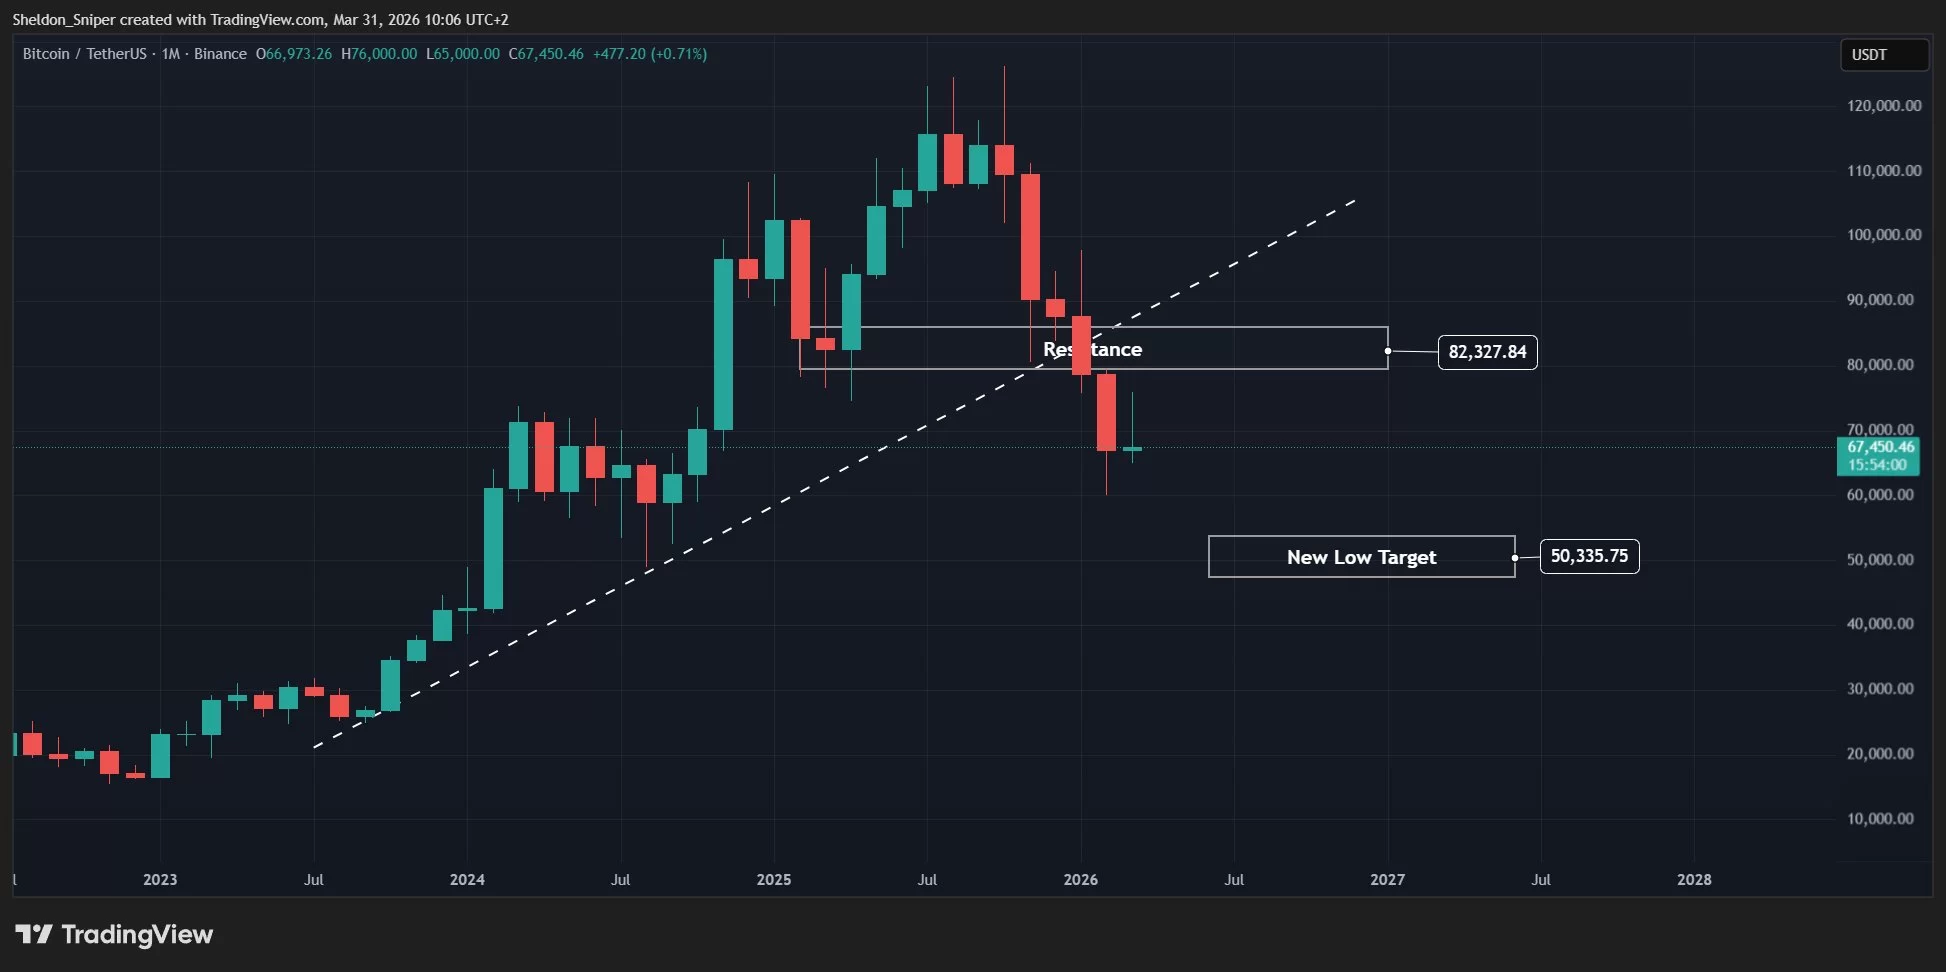
Sheldon Diedericks highlighted that the upcoming monthly close could establish a bullish trend on the Bitcoin chart. His projection suggests that Bitcoin could make a push toward the resistance zone around $83,000 during April. However, he also cautioned that once this resistance level is tested, Bitcoin may face renewed selling pressure and the potential for a more pronounced decline. This perspective echoes the views of other market observers, like those at Roman Trading, who foresee an interim rally before the market possibly seeks lower support levels.
Strategic cautions from leading analysts
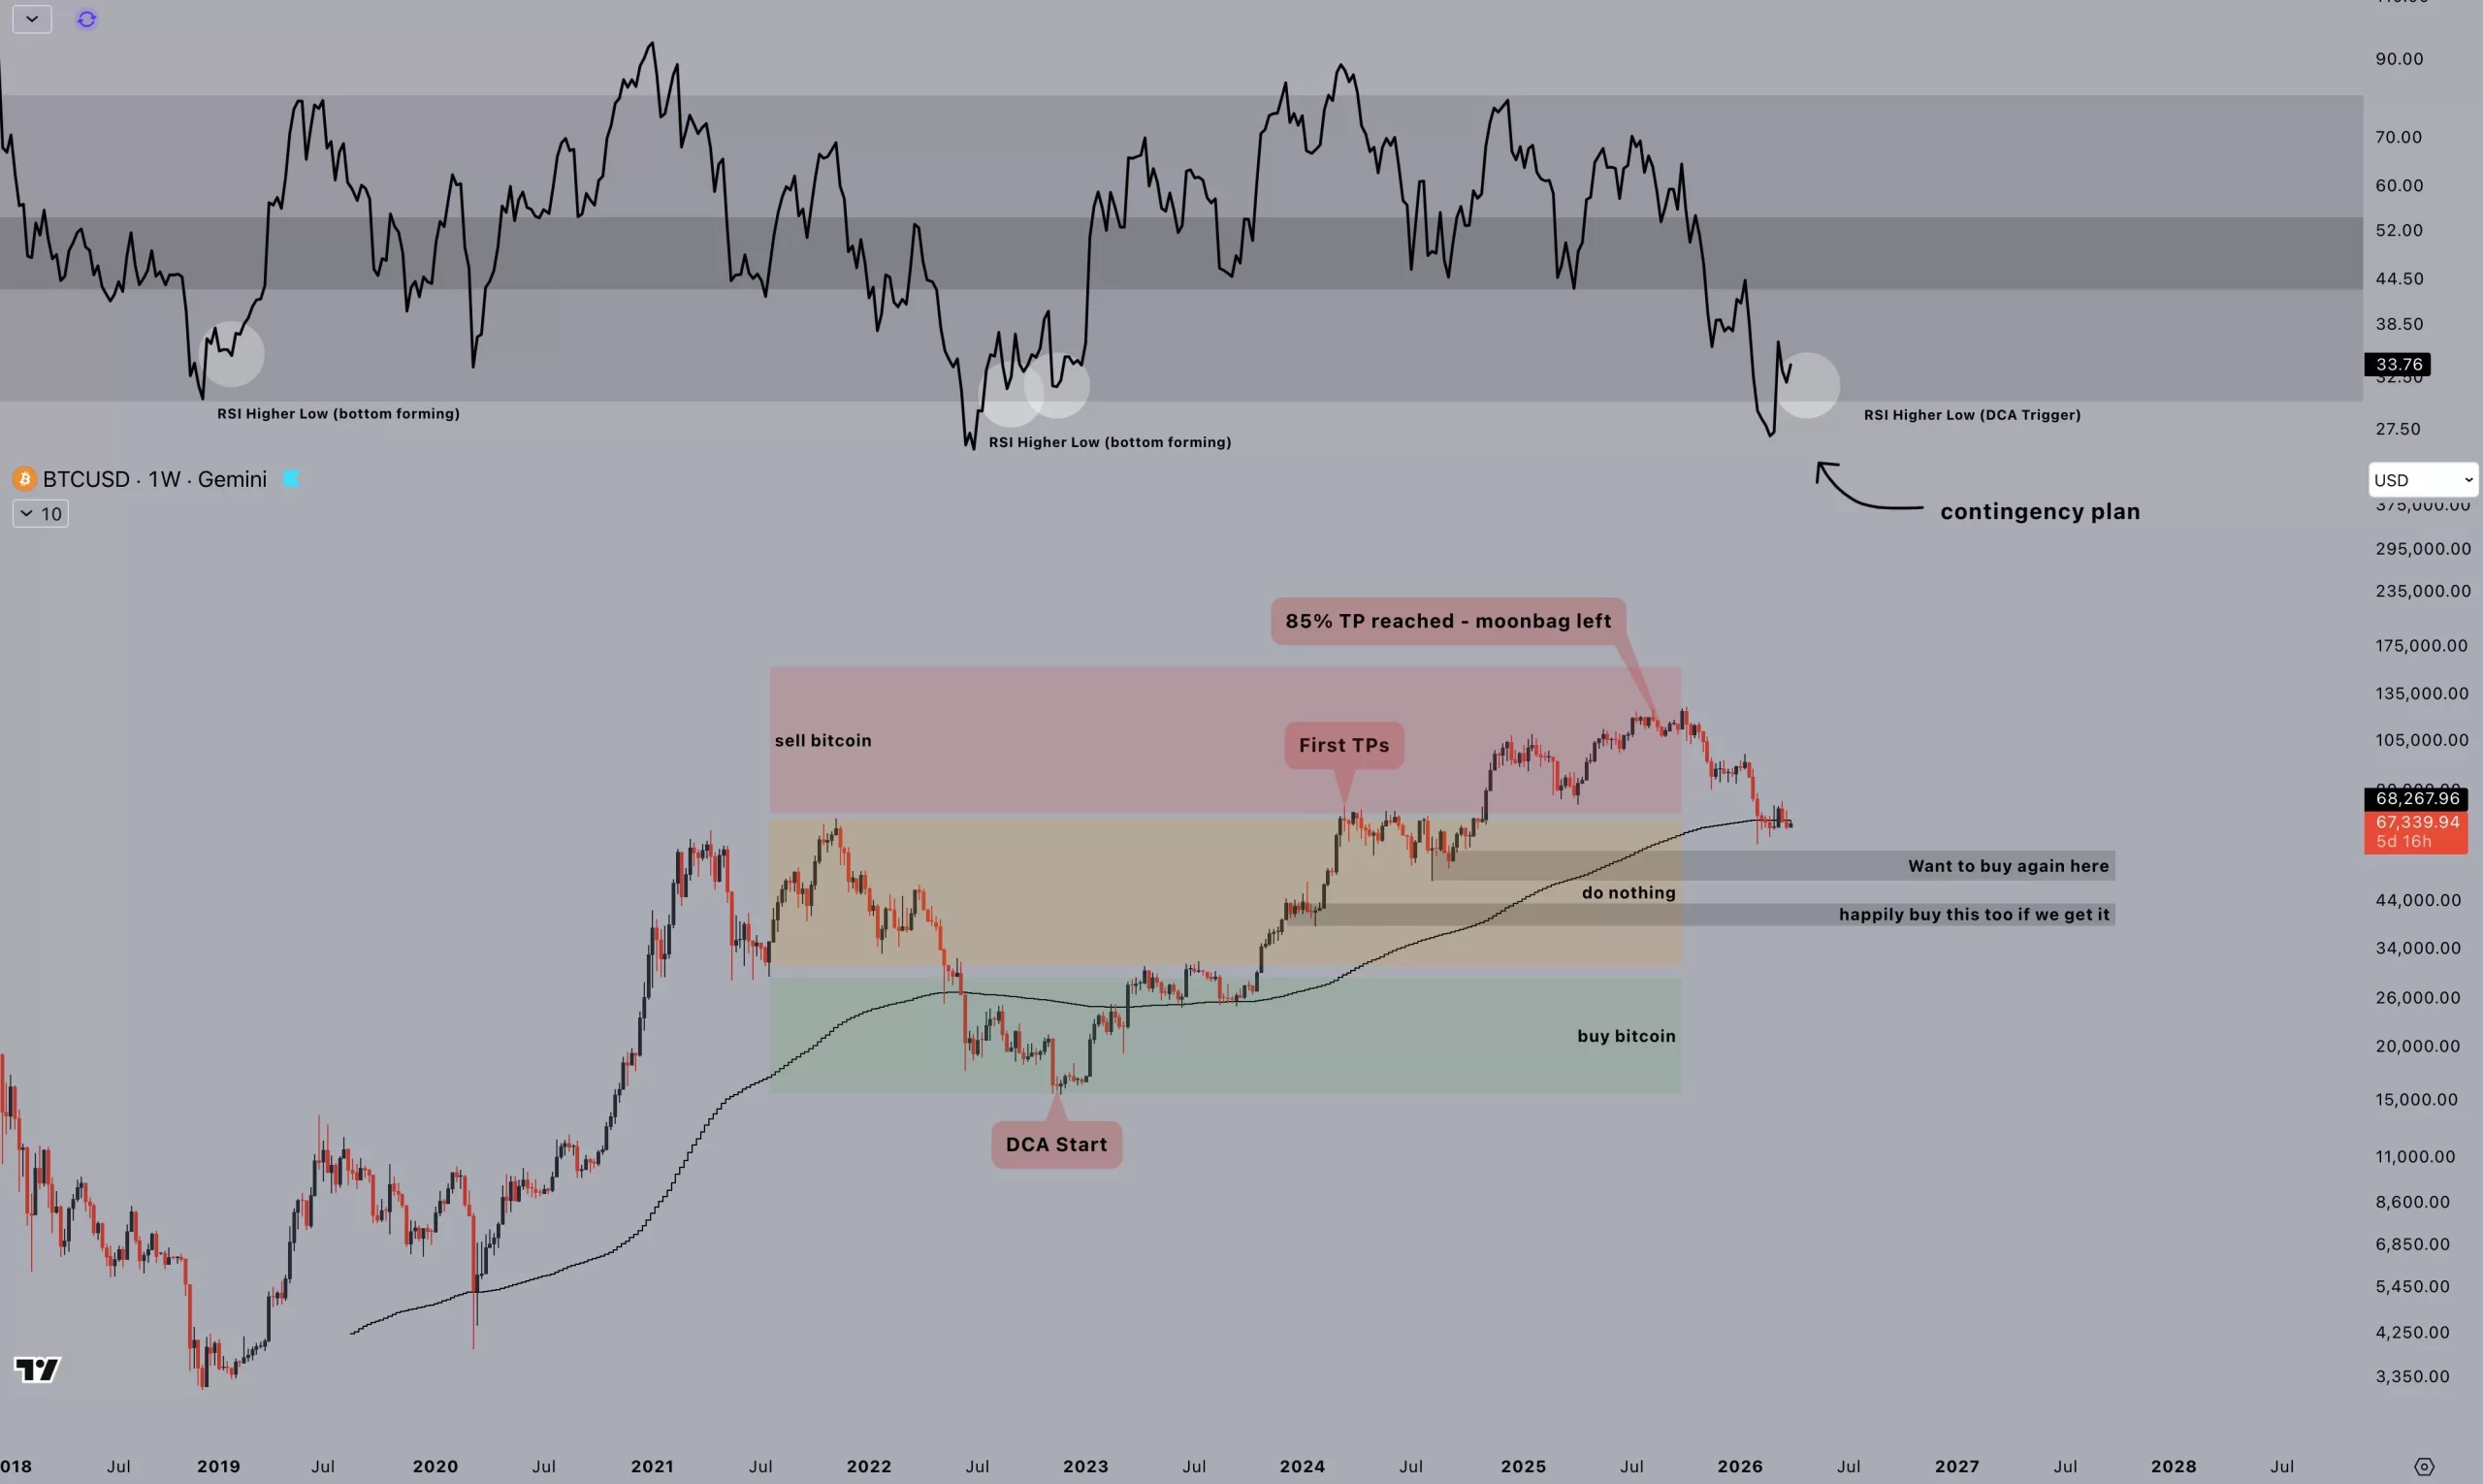
Sheldon’s current downside target rests at $50,335, flagging the risk of a substantial pullback if support breaks. Meanwhile, analyst Jelle has demonstrated a careful, methodical approach to market cycles over the last three years, adhering to the Dollar Cost Averaging (DCA) strategy. By identifying accumulation and phased sell zones in advance, Jelle began shifting to cash before the recent downturn gained momentum, rather than waiting for the exact top of the former rally.
In the latest market update, Jelle shared an updated chart and reflected on his disciplined approach:
“Many of you will recall my bull market plan: a straightforward strategy of gradually closing positions as prices climb.
Getting back into the market is a bit more nuanced, and this chart shows how I approach it. Either I secure my preferred purchase levels, or if the RSI signals it’s time to start buying, I resume DCA.
When the market hits weekly oversold conditions and forms a strong higher low, it’s typically a solid buying opportunity. When that setup emerges, I won’t ignore it – but until then, I’ll keep waiting for lower prices.”
Jelle’s latest comments reflect a cautious stance, indicating that he does not yet see sufficient signals for aggressive buying. He noted that geopolitical tensions, particularly involving Iran, could play a role in establishing Bitcoin’s next significant bottom.
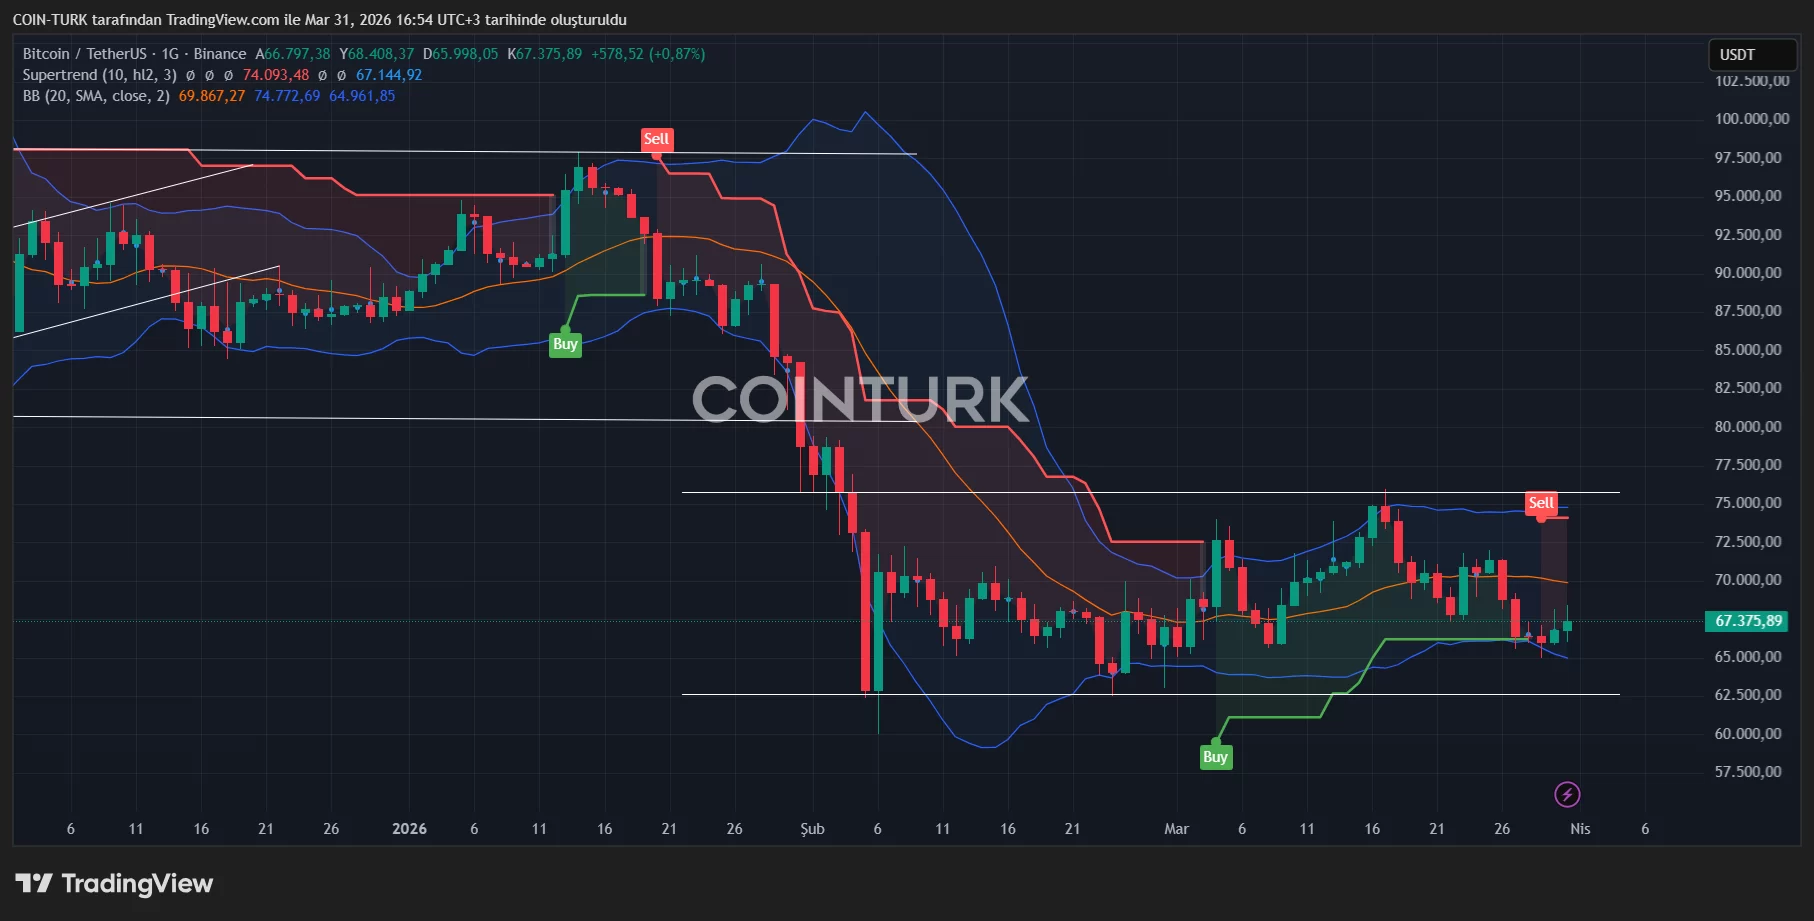
Turning to recent price action, Bitcoin has lingered within the same range for the past 57 days, repeatedly failing to secure a lasting move above $70,000. Given current news flow and the lack of bullish catalysts, this continued sideways trading is not especially surprising. Bears have repeatedly attempted to push the price below $65,000 in pursuit of deeper lows, though without sustained success so far. That said, repeated tests of support can weaken this area, increasing the likelihood that it could eventually give way and lead to further declines.
Adding to these technical signals, recent U.S. economic data released during the preparation of this report suggest rising unemployment may accelerate alongside inflation. With Bitcoin consolidating for nearly two months and current headlines raising uncertainty, both investors and traders should brace for heightened volatility over the next 10 to 15 days, as a decisive move in either direction grows increasingly likely.
In summary, while bulls and bears continue their tug-of-war around key support and resistance levels, leading analysts stress the importance of vigilance. Those watching the broader economic and geopolitical developments may find valuable clues that shape Bitcoin’s next major trend. With markets awaiting a decisive break, caution and flexibility remain essential traits during this uncertain phase.